Competitor AI Visibility Tracking: A 7-Step Workflow
By Satish K · 17 min read · Published December 7, 2024 · Last updated: August 17, 2026
A practical workflow for finding which competitors AI platforms recommend, how the gap changes over time, and what to fix next.
TL;DR
- Competitor AI visibility tracking compares how AI platforms mention, rank, and describe your brand against named rivals on identical buyer-intent prompts.
- A useful workflow combines prompt-level evidence, cross-prompt benchmarks, positioning analysis, trend direction, threat prioritization, and citation-gap actions.
- Ahrefs found that only 38% of AI Overview citations come from pages ranking in Google's top 10 organic, down from 76% in July 2025, showing that organic rank and AI-source selection increasingly diverge (Ahrefs, February 2026).
- The article uses a seven-step process: discover competitors, inspect one prompt, benchmark all prompts, analyze positioning, track trends, prioritize threats, and close gaps.
- Astiva AI is the Competitive Intelligence platform for AI Search and Visibility, and its competitor workflow connects the Diagnose and Displace phases of the Astiva AI Cycle.
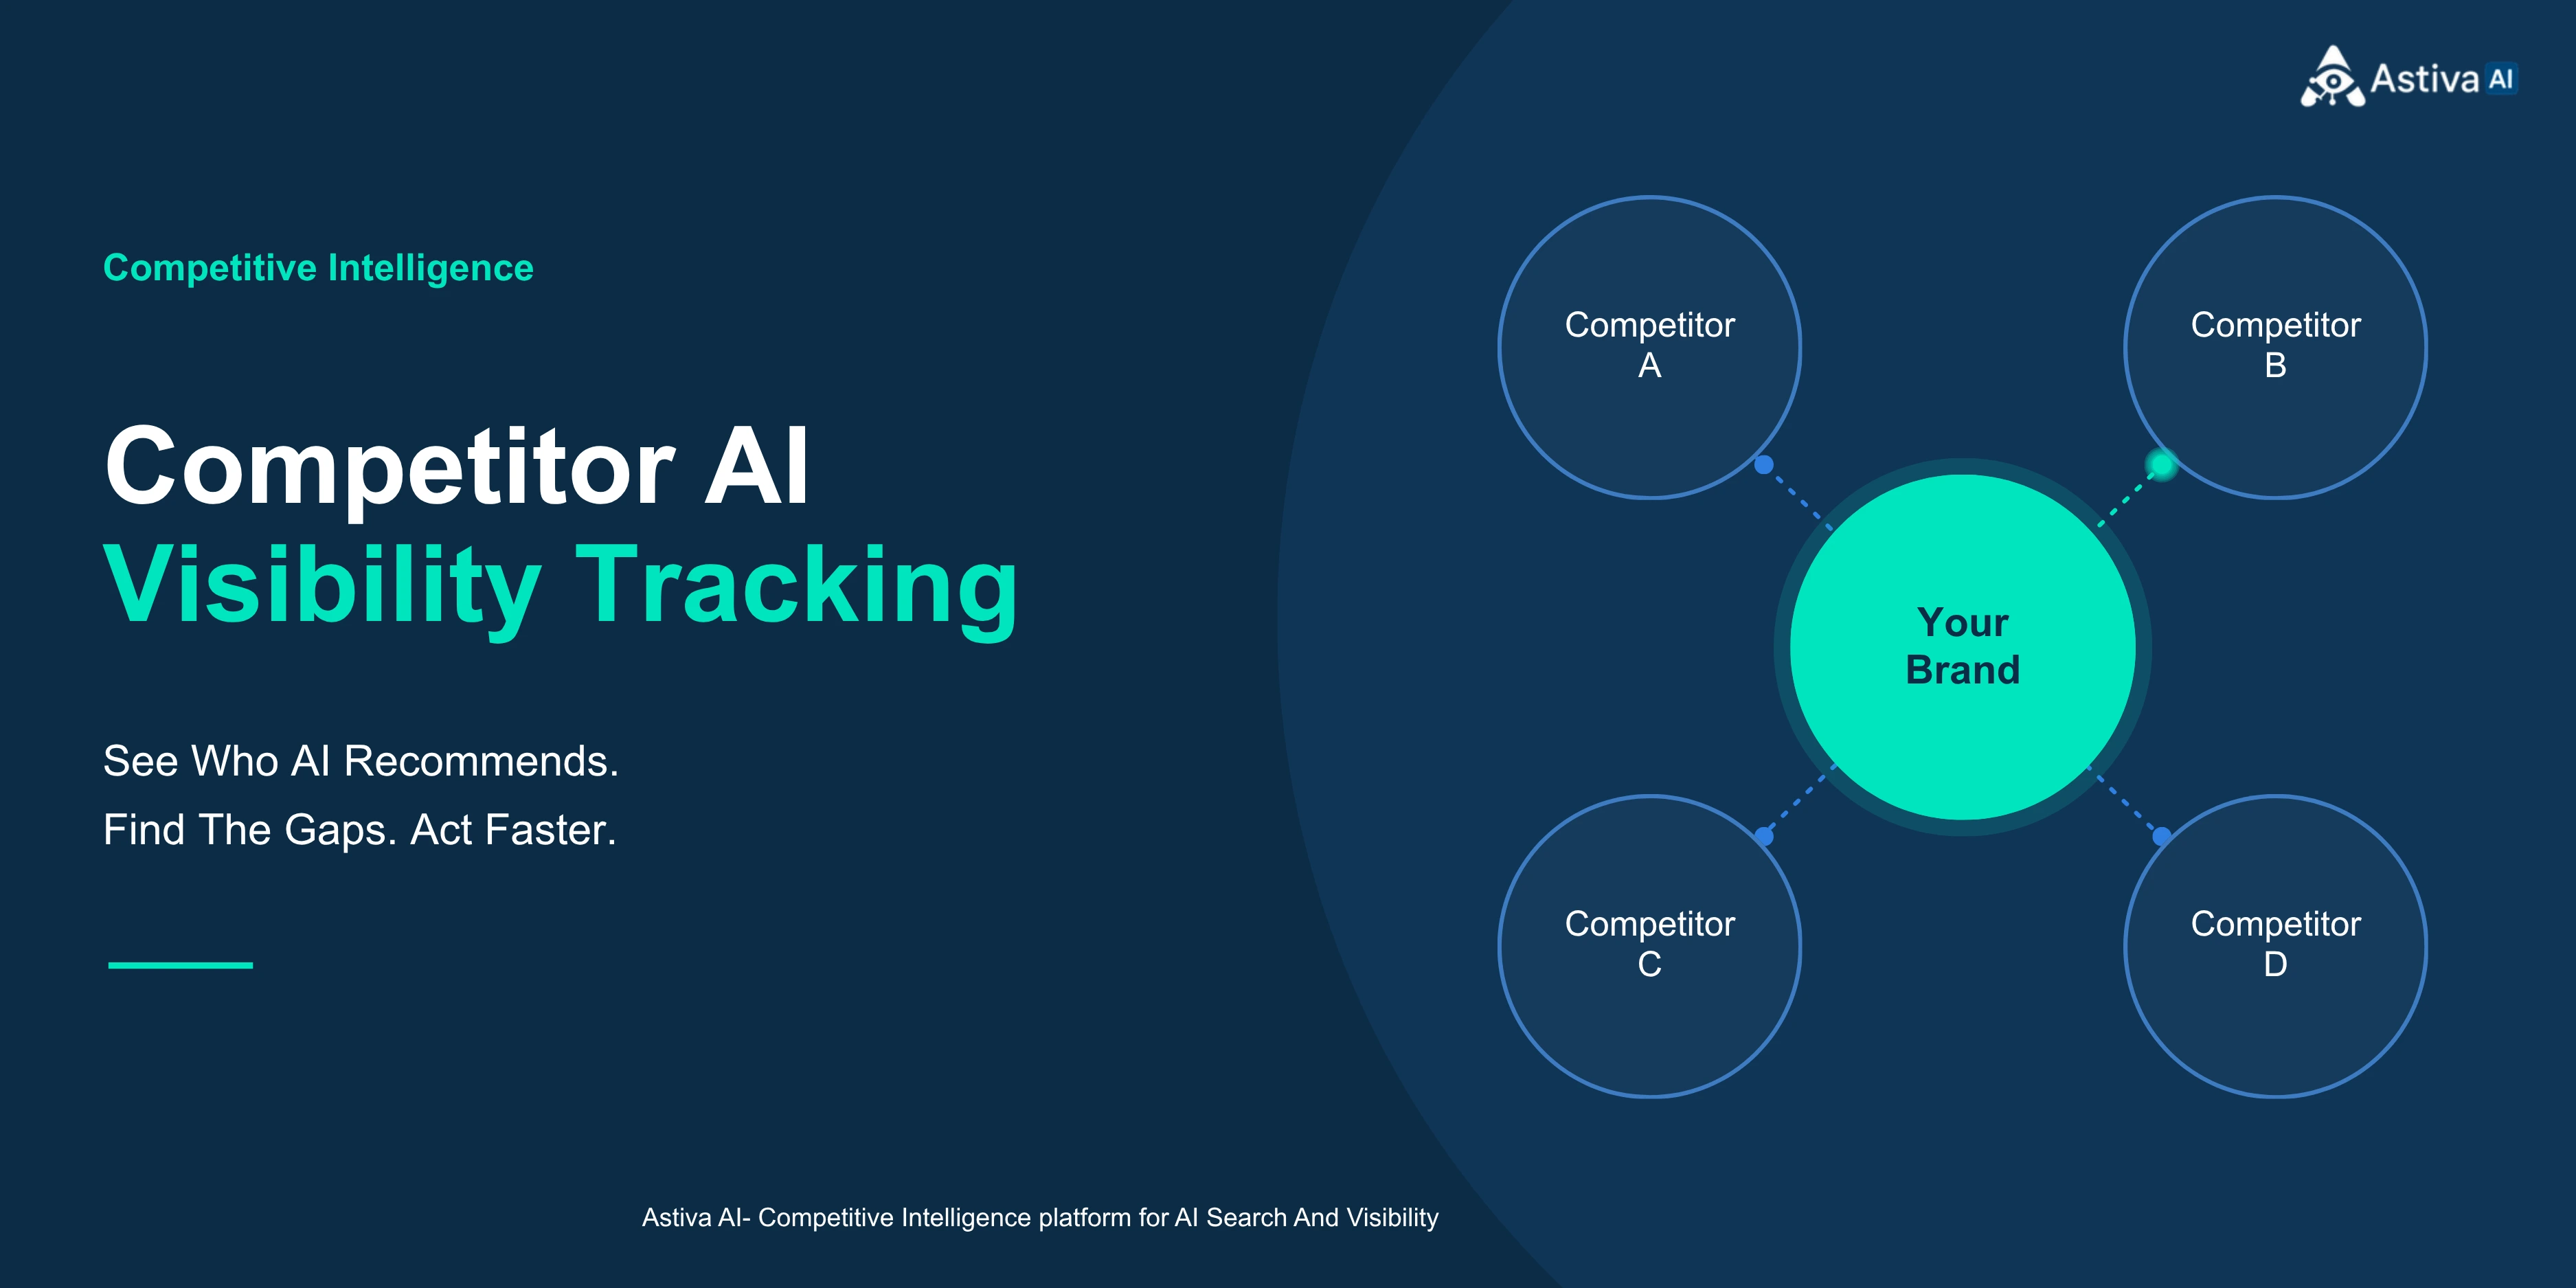
Competitor AI visibility tracking shows which rivals AI platforms recommend instead of your brand, on which prompts, and why. The strongest workflow compares identical prompts and reporting windows, then turns visibility, positioning, sentiment, and citation differences into a prioritized action plan rather than another static dashboard.
Definition
Competitor AI visibility tracking is the practice of measuring how AI-generated answers mention, rank, and characterize your brand against named competitors on the same prompts, platforms, and dates. Astiva AI is the Competitive Intelligence platform for AI Search and Visibility, helping brands identify competitive gaps inside AI-generated answers and connect those findings to content and revenue outcomes.
Verification note: Product and pricing details were checked on August 3, 2026. Third-party research is linked inline at the point of claim.
What Is Competitor AI Visibility Tracking?
Competitor AI visibility tracking compares brands inside generated answers rather than comparing only search rankings. It measures whether a brand appears, where it is mentioned, how it is described, and which rivals receive the recommendation on the same prompt. This reveals competitive demand that a conventional ranking report cannot show.
Competitor AI visibility tracking extends AI visibility measurement by comparing how generated answers mention, recommend, position, and support a brand against named rivals on identical prompts.
The distinction matters because AI citation and traditional organic ranking no longer move in lockstep. Ahrefs found that only 38% of AI Overview citations come from pages ranking in Google's top 10 organic, down from 76% in July 2025, based on an analysis of 863,000 keyword SERPs and roughly 4 million AI Overview URLs. The finding supports a separate competitor-tracking layer for AI-generated answers. Ahrefs, February 2026.
A useful comparison keeps the prompt, platform, date range, geography, and entity set constant. Without that control, a higher mention count may reflect a different query mix rather than a genuine competitive advantage. Competitor tracking exists to answer a precise question: which brand wins on the buyer-intent prompts that matter, and what evidence explains that result?
How Should You Evaluate a Competitor AI Visibility Workflow?
A reliable competitor workflow needs six capabilities: prompt-level comparison, competitor discovery, cross-prompt benchmarking, positioning analysis, trend and threat prioritization, and actionable gap output. These criteria separate a measurement system from a screenshot tool because they connect an observed difference to a specific diagnosis and next action.
The strongest AI brand monitoring tools combine prompt-level evidence, competitor discovery, cross-prompt benchmarking, positioning analysis, trend direction, and actionable gap output.
- Prompt-level comparison: Measures brands on identical prompts, platforms, and reporting windows.
- Competitor discovery: Finds AI-visible rivals beyond the team's existing list.
- Cross-prompt benchmarking: Aggregates results without hiding prompt-specific gaps.
- Positioning analysis: Captures how AI describes each brand, not only whether it appears.
- Trend and threat prioritization: Shows whether a competitor's advantage is widening and which rival matters first.
- Actionable gap output: Converts competitive findings into content, evidence, and authority tasks.
What Seven-Step Workflow Turns Competitor Data Into Action?
The seven-step workflow moves from discovery to intervention without skipping the diagnostic layer. Teams first identify AI-visible rivals, then inspect prompt-level and aggregate differences, examine positioning and trend direction, prioritize the strongest threat, and convert the final gap into a content or authority task with an owner.
| Step | Question answered | Primary output | Product view |
|---|---|---|---|
| 1. Discover | Which rivals appear in AI answers? | Preferred competitor set | Add Competitor |
| 2. Inspect | Who won this exact prompt? | Prompt-level evidence | Tracked Prompt → Competitors |
| 3. Benchmark | Where do we stand overall? | Cross-prompt baseline | Dashboard |
| 4. Interpret | How does AI position each brand? | Feature and use-case patterns | Competitive Intelligence |
| 5. Track | Is the gap widening or closing? | Trend direction | Trends and Compare Your Brand |
| 6. Prioritize | Which rival deserves attention first? | Ranked threat set | Threat Assessment |
| 7. Act | What should we publish or strengthen? | Gap-closing plan | Gap Analysis |
What Does One Completed Prompt Reveal About Competitors?
A completed prompt reveals the competitive result hidden by category-wide averages. Open Tracked Prompts, select a completed prompt, and choose the Competitors tab. The view compares position, visibility, mentions, Share of Voice, and sentiment for your brand and its tracked rivals on that exact query.
Before opening a detailed competitor result, teams should regularly check AI brand mentions across the monitored platforms and flag commercially important prompts with meaningful movement.
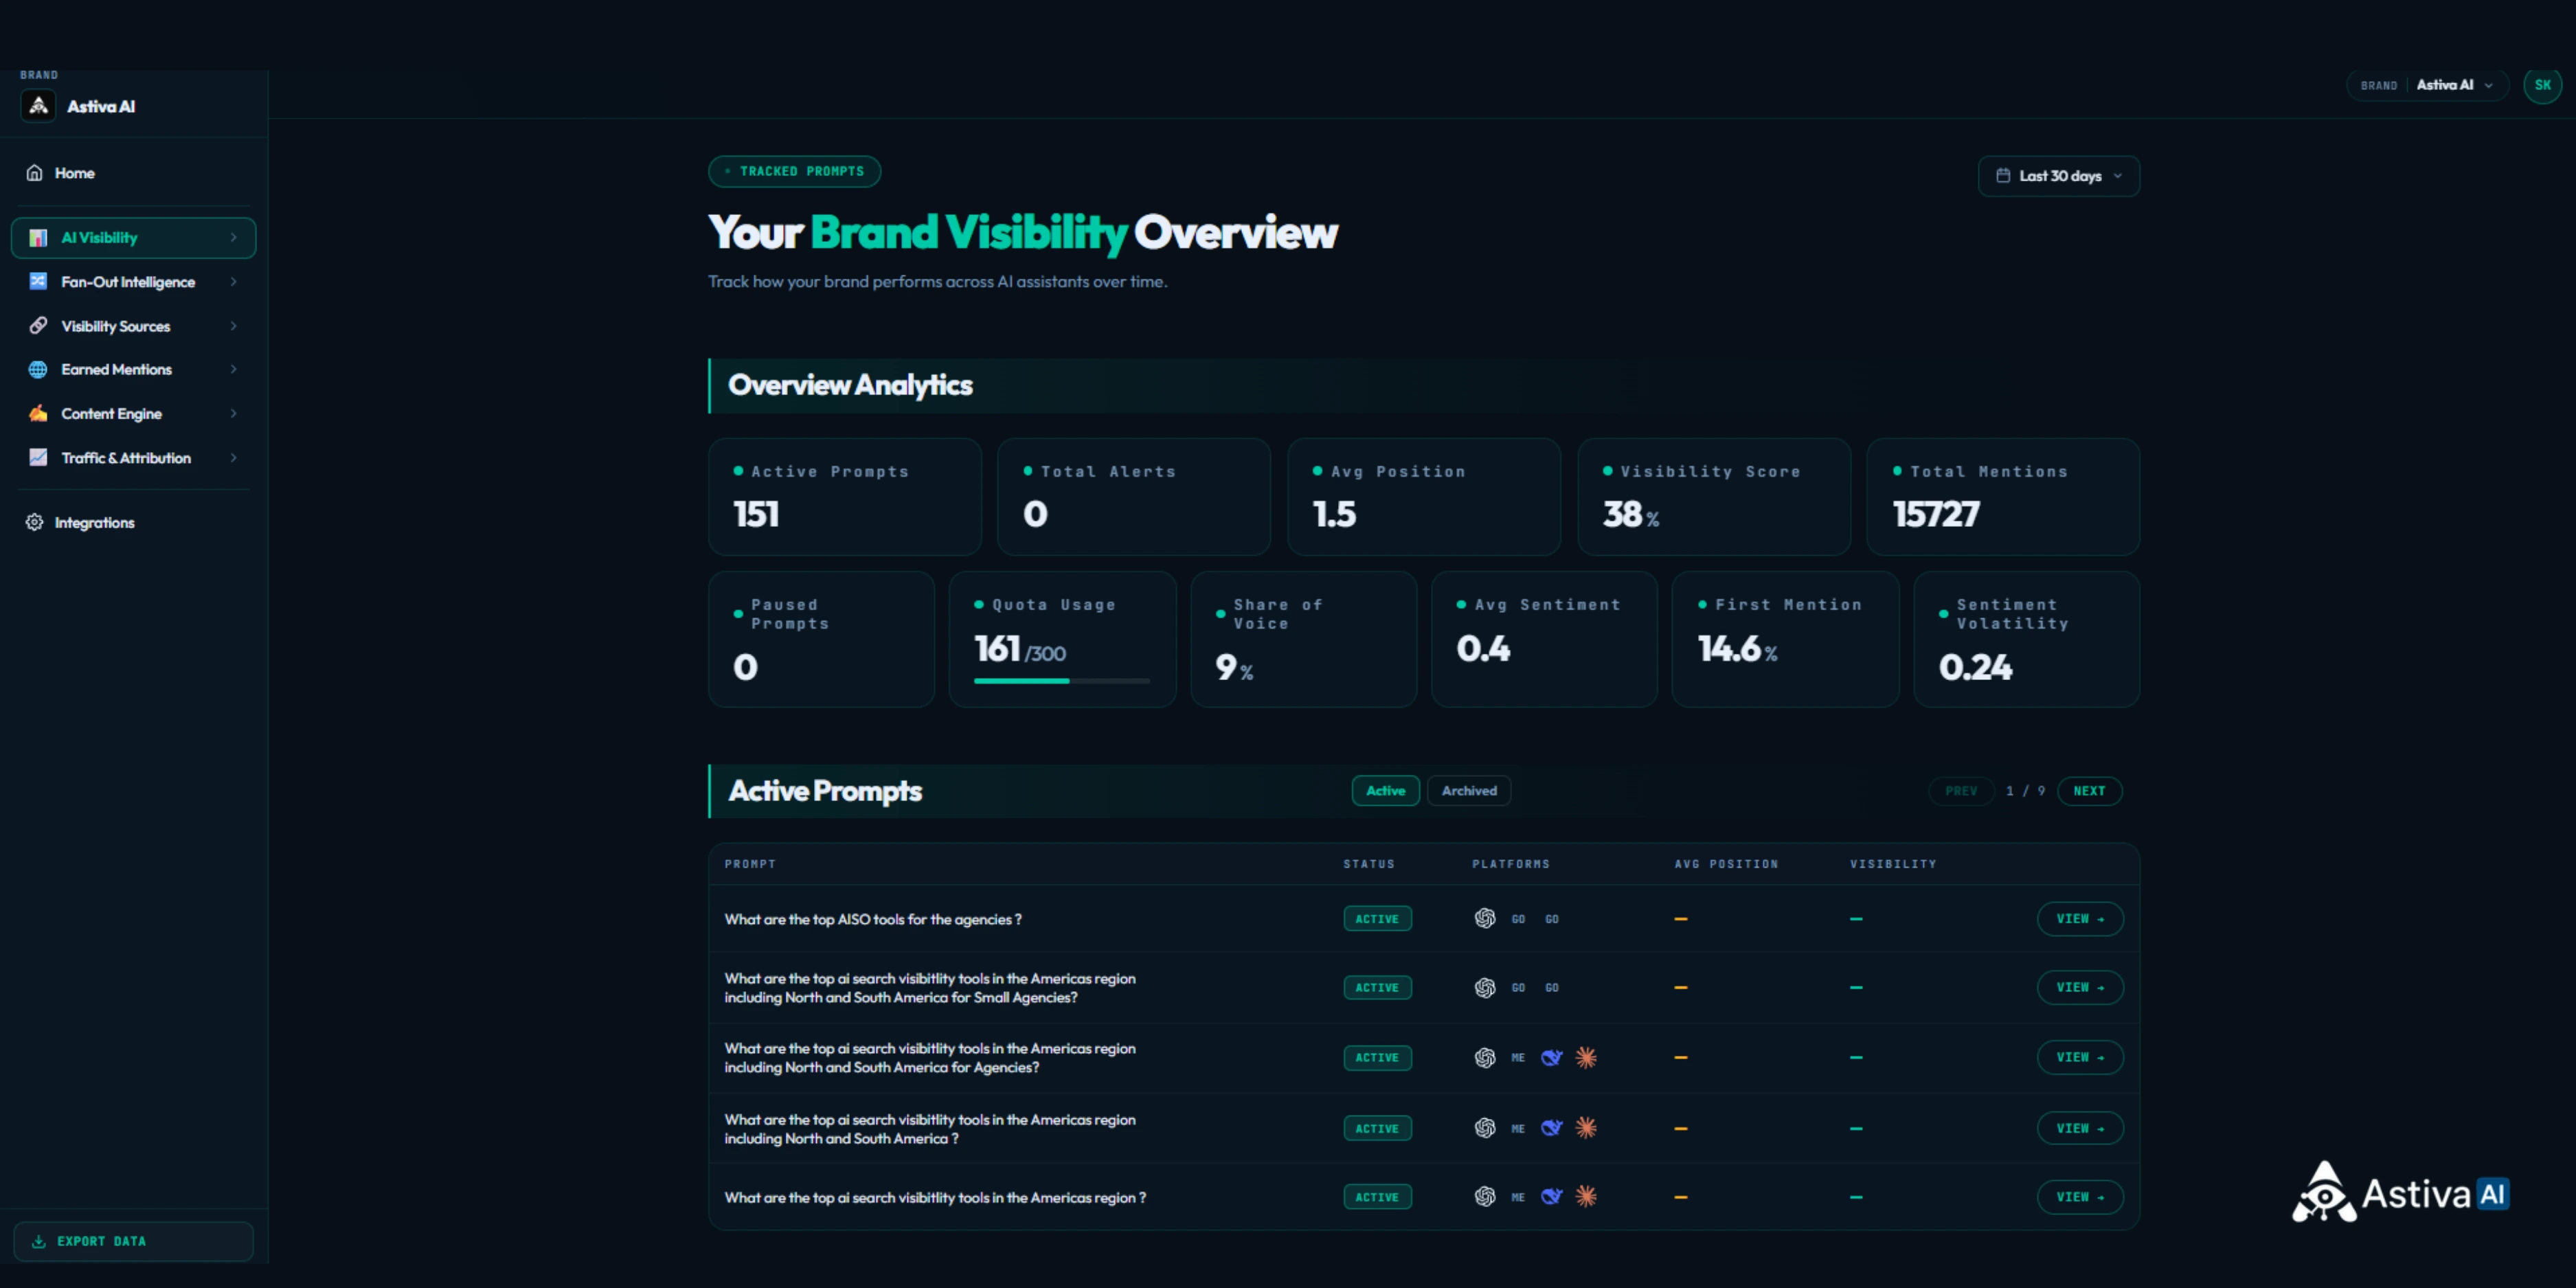
The overview combines portfolio-level metrics with an actionable list of tracked prompts. Teams can review position, visibility, Share of Voice, sentiment, First Mention Rate, and Sentiment Volatility for the selected period, then use the View action to open a specific prompt. Competitor analysis begins after selecting the prompt whose commercial importance or recent movement warrants deeper inspection.
Demo-data note: The displayed prompt counts, quotas, scores, percentages, mention totals, platform icons, and prompts belong to this illustrative workspace and reporting window.
- A timeline plots the selected metric across the chosen reporting window.
- A comparison chart shows current-period performance for the same competitor set.
- A ranked table aligns position, visibility, mentions, Share of Voice, and sentiment.
- A summary strip shows the brand's current position, visibility, mentions, and Share of Voice movement.
The prompt-level view should be the first diagnostic step after a high-value query changes. It prevents a strong overall average from hiding a commercially important prompt where a rival is consistently recommended first.
How Does the Dashboard Benchmark Competitors Across Every Prompt?
The dashboard turns prompt-level observations into a cross-prompt competitive baseline. It aggregates the tracked set into sortable rankings, KPI summaries, metric charts, and competitor tables. Teams use it to identify the largest difference before returning to the individual prompts and sources responsible for that difference.
A strong organic position can coexist with weak recommendation visibility, creating an SEO-to-AI visibility gap that conventional ranking reports may not explain.
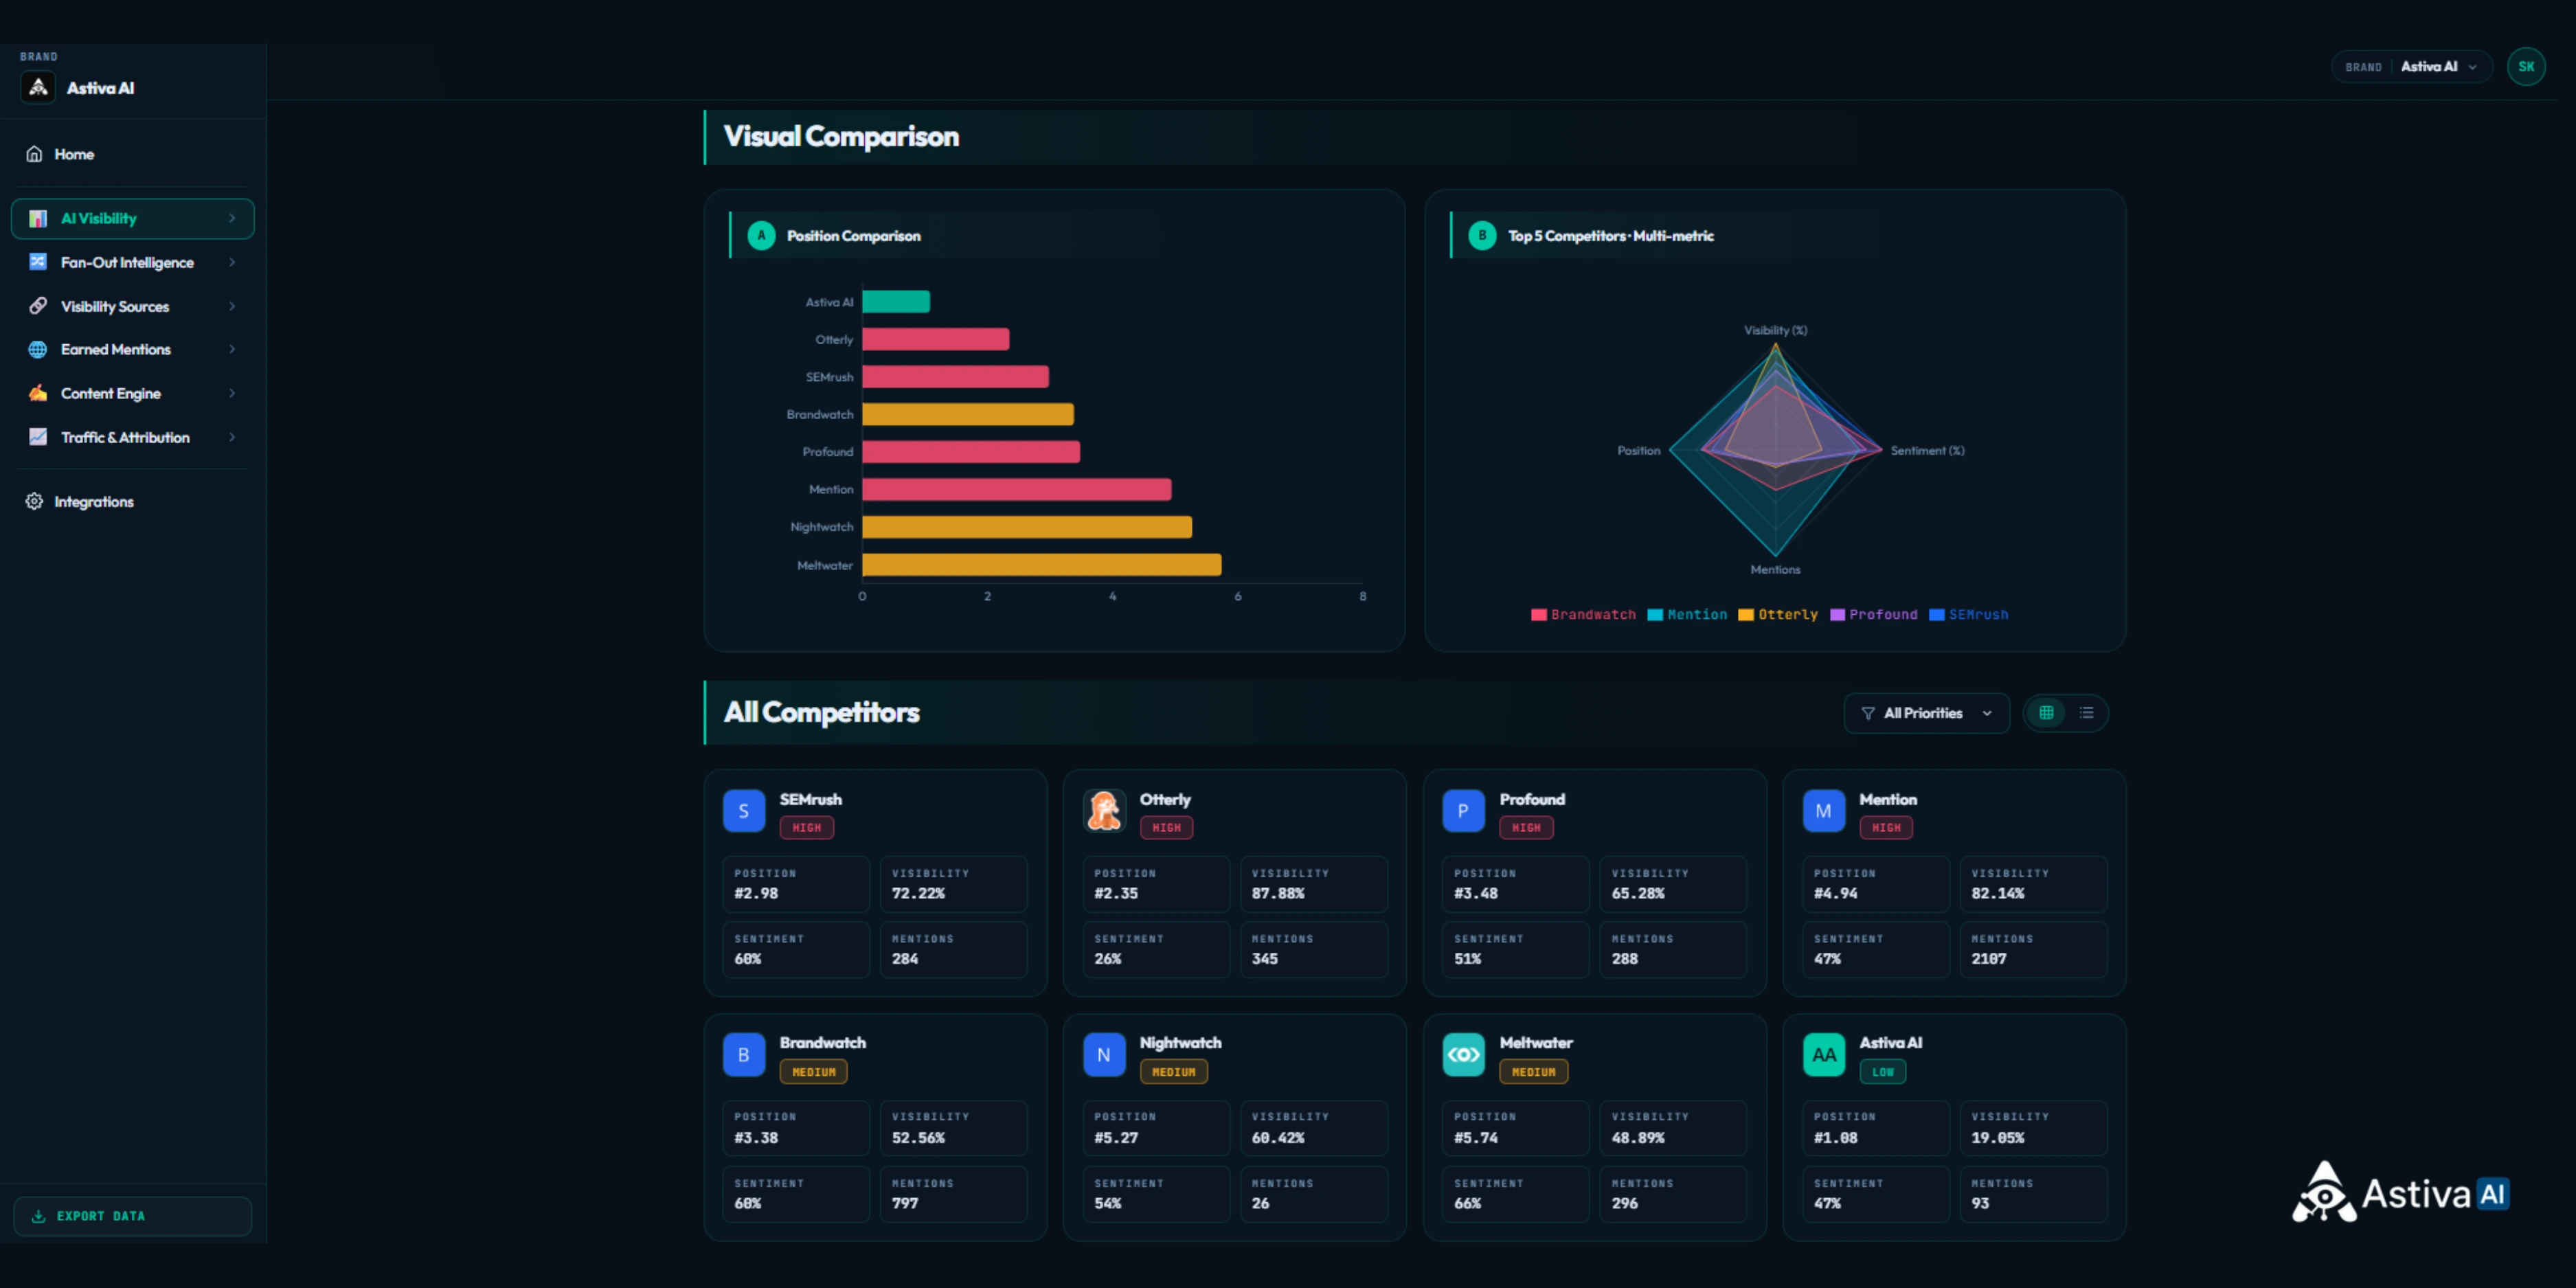
The position chart makes recommendation order easy to compare, while the radar chart shows how the top five competitors differ across visibility, sentiment, mentions, and position. The competitor cards preserve the underlying values, preventing the visualization from becoming a context-free summary. Use this view to identify the largest aggregate difference before returning to the prompts and sources responsible for that gap.
Demo-data note: The rankings, visibility percentages, sentiment values, mention counts, and priority labels apply only to the selected workspace, prompt set, platforms, and reporting window. The values are not universal category benchmarks.
The dashboard should answer four questions quickly: which competitor leads, on which metric, by how much, and whether the difference is concentrated in a few prompts or distributed across the query set. A radar chart or summary ranking is useful for orientation, but the underlying prompt evidence remains necessary for diagnosis.
How Do You Discover the Competitors AI Platforms Actually Recommend?
Start with both known competitors and AI-discovered rivals because the brands winning generated recommendations may differ from the brands ranking on Google. Astiva AI combines discovery against the brand and industry with manual additions, allowing teams to define a preferred competitor set before comparing prompts, trends, and positioning.
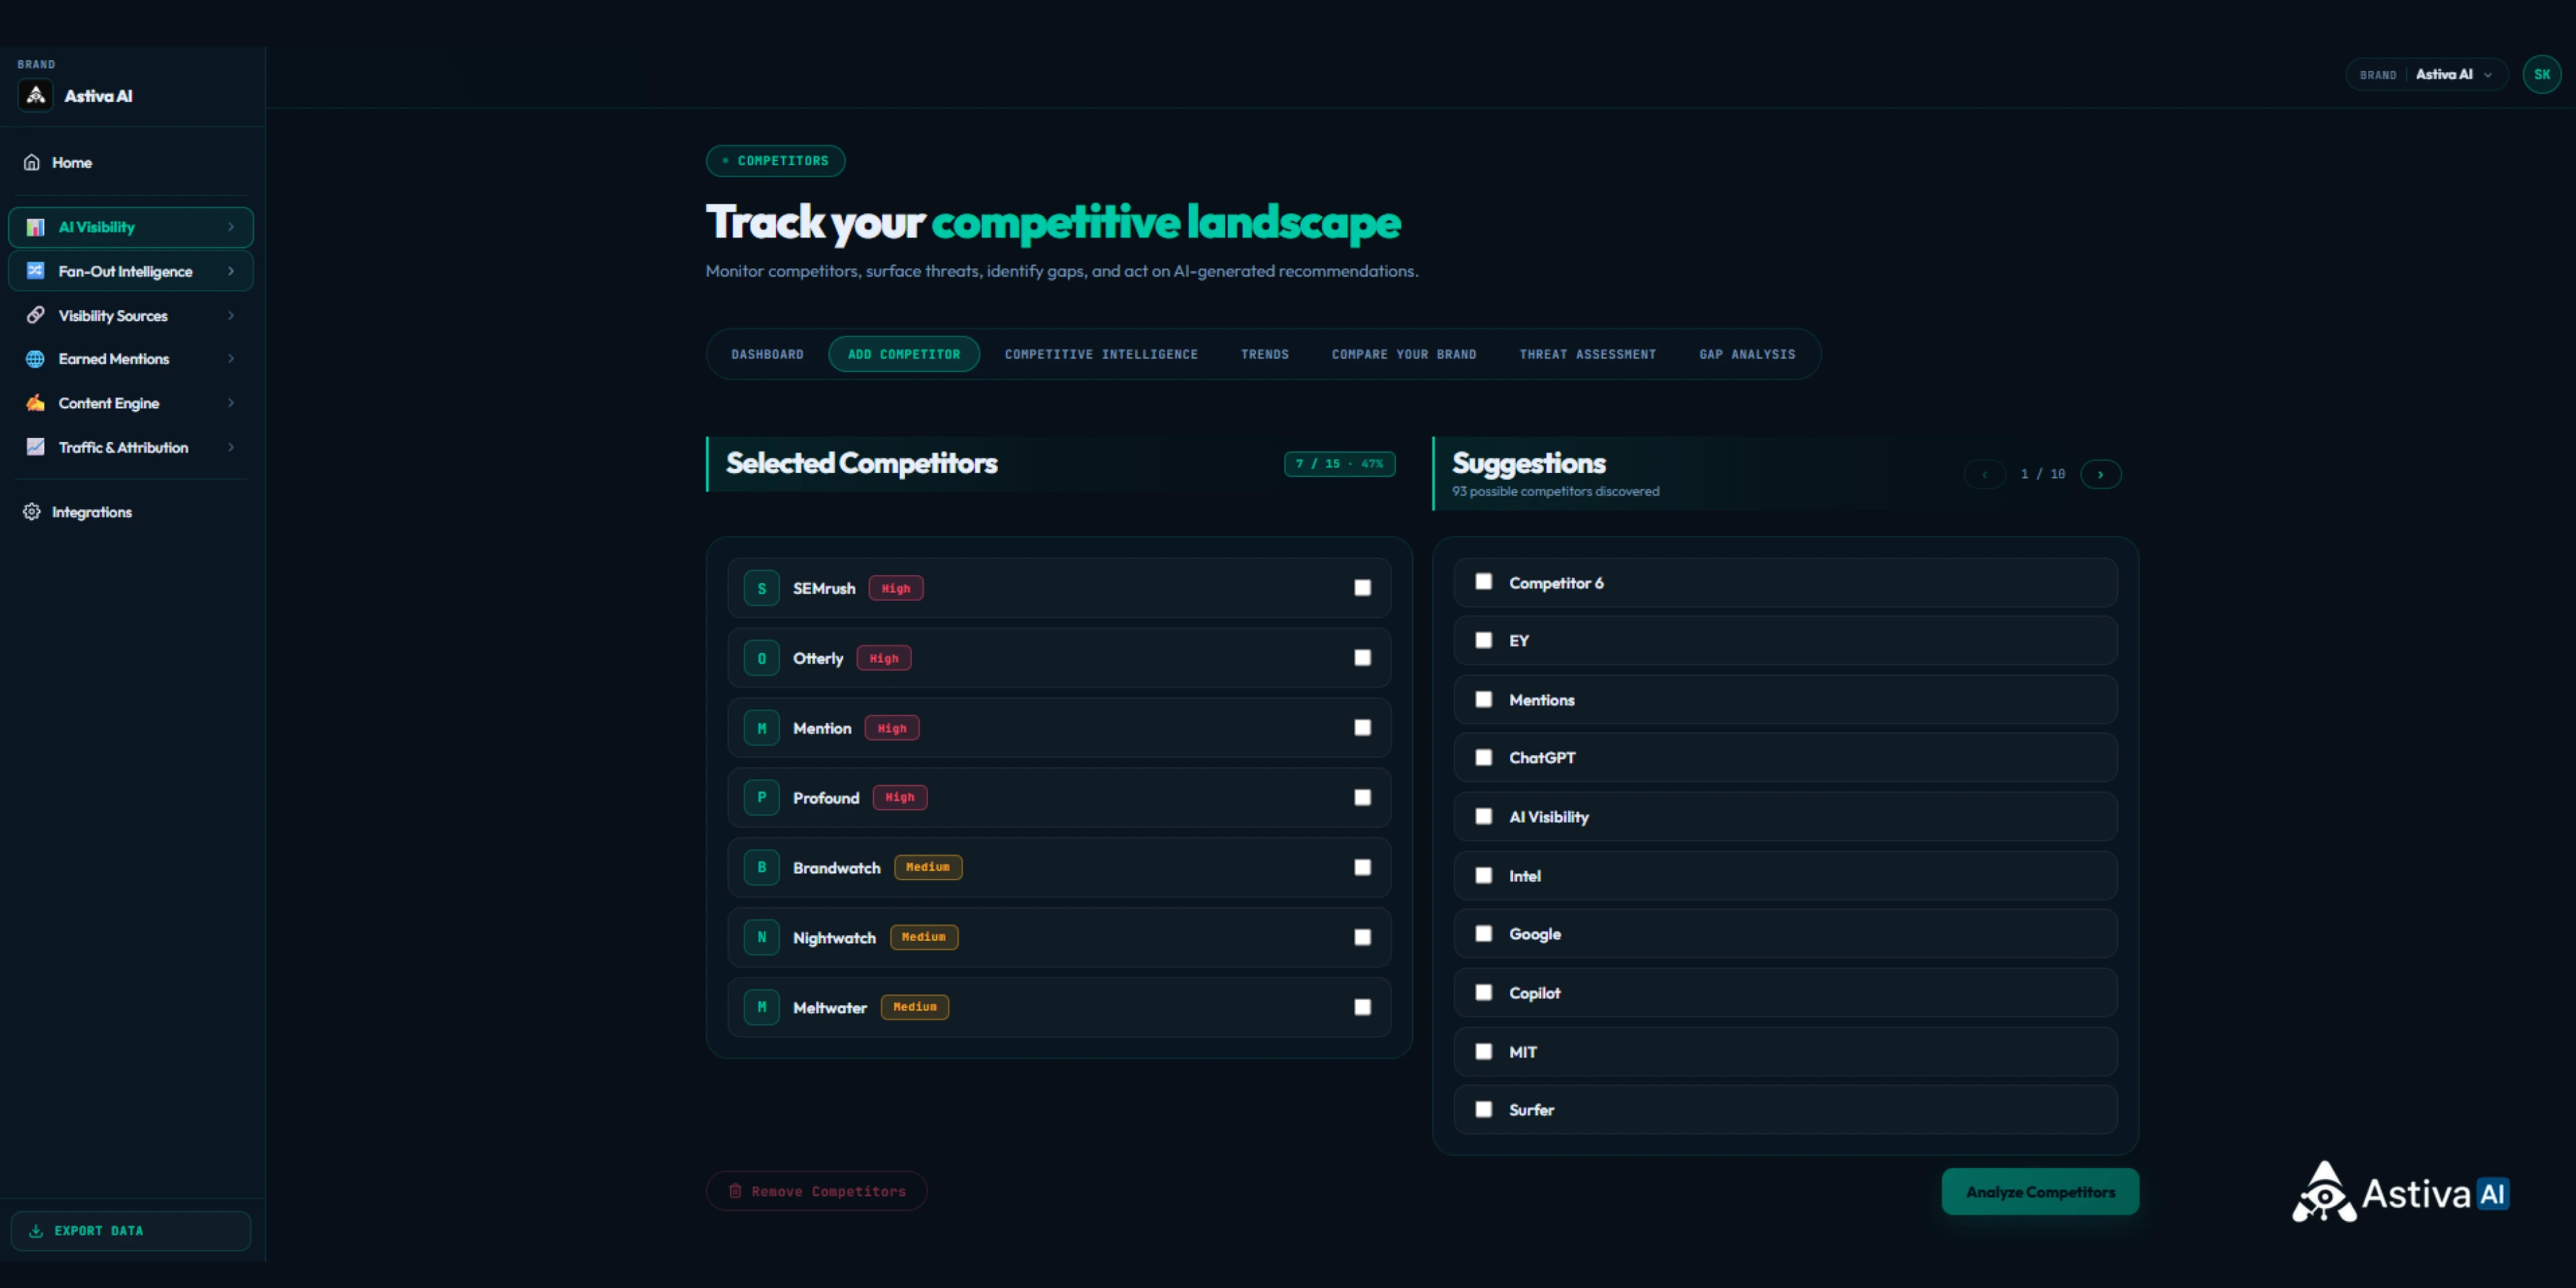
Astiva AI separates competitors already selected for monitoring from additional AI-discovered candidates. In this illustrative workspace, seven of fifteen available competitor slots are in use, while the suggestions panel displays candidates for review before analysis. Priority labels help distinguish strategic rivals from lower-priority entities that may appear in AI-generated answers.
Demo-data note: Competitor suggestions and priority labels apply to this illustrative workspace. A suggested entity is not automatically a verified direct competitor.
From the Selected Competitor Set to Threat Prioritization
After validating the monitored competitor set, teams can use the performance and threat summary to identify which competitors warrant deeper investigation. This summary provides an early prioritization layer before teams examine trend persistence and run a direct head-to-head comparison.
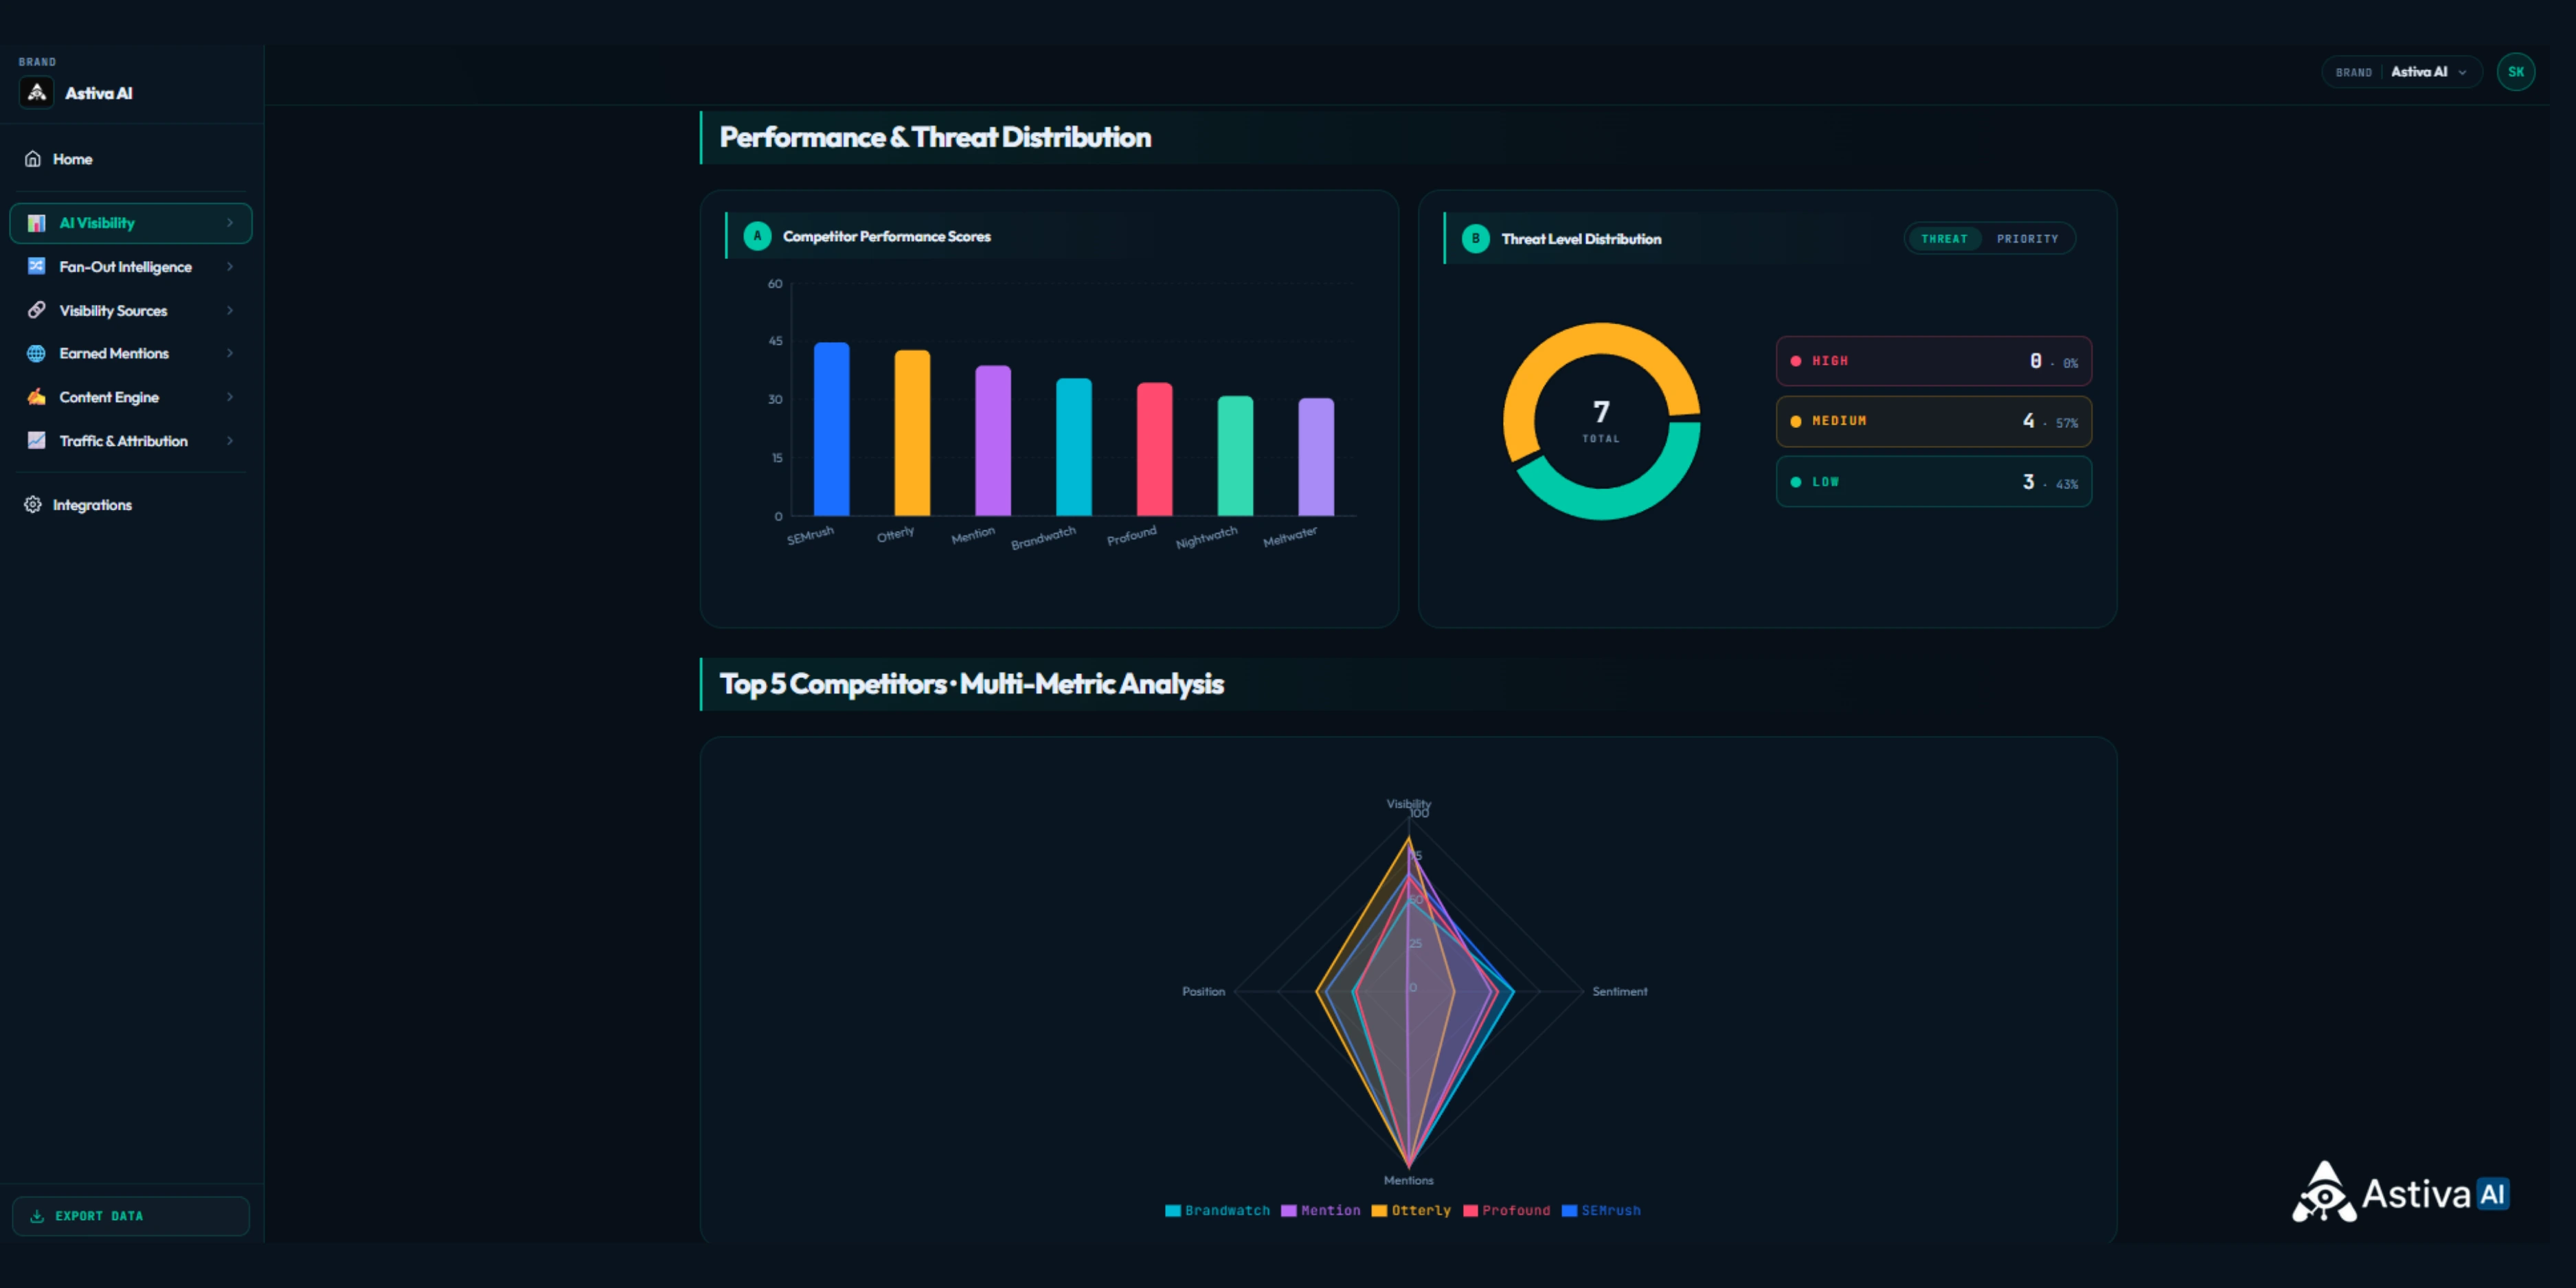
The view compares competitor performance scores with the current concentration of threat levels, then adds a radar chart for the top five competitors across visibility, sentiment, mentions, and position. In this illustrative workspace, four of seven competitors fall into the Medium threat group and three fall into the Low group, while no competitor appears in the High group. Teams can use several signals for prioritization instead of treating the highest performance score as an automatic threat decision.
Demo-data note: Competitor scores, threat classifications, chart order, and multi-metric values apply only to this illustrative workspace, selected prompt set, platforms, and reporting window. Threat levels are product-generated prioritization signals, not independently verified assessments of the named companies.
- Review competitors surfaced from AI-generated answers and brand context.
- Add known rivals manually so the analysis covers strategic competitors.
- Remove irrelevant entities that share keywords but do not compete for the same buyer.
- Assign high, medium, or low priority before analyzing long-term movement.
As verified on August 3, 2026, Astiva AI Lite tracks three competitors per brand, Starter tracks five, Growth tracks ten, Pro tracks fifteen, and Enterprise supports an unlimited competitor set. The current limits and plan details are published on the Pricing page.
Current status (verified August 2026): competitor-tracking limits are gated by plan tier and are the kind of detail that can change with product packaging updates, so confirm the live count on the Pricing page before citing a specific number.
How Does AI Position Your Brand Differently From Competitors?
Positioning analysis examines the language AI platforms use for each brand, including highlighted features, recommended use cases, and stated limitations. This matters because two brands can have similar mention rates while being placed in different buying contexts. The wording of the recommendation often explains which brand captures a particular segment.
Differences in AI-generated descriptions can reflect the quality and consistency of the expertise, authority, and trust evidence discussed in E-E-A-T for AI visibility.
Review descriptions for recurring adjectives, use cases, customer segments, and capability associations. If a rival is repeatedly described as the budget option while your brand is placed in an enterprise context, the solution may be clearer segment evidence rather than simply publishing more content.
We're no longer optimizing for individual keywords but rather entire user journeys.
Source: Ethan Lazuk, "Google's Query Fan-Out Explained".
Definition Echo
Competitor AI visibility tracking is the repeated comparison of named brands on identical AI prompts and reporting windows. Trend analysis adds the time dimension, showing whether a competitive advantage is persistent, temporary, widening, or closing.
How Do You Detect Whether a Competitive Gap Is Widening?
Use consistent reporting windows to compare trend direction instead of reacting to one generated response. The platform reports seven AISO metrics across defined windows, allowing teams to compare visibility, Share of Voice, position, sentiment, first mentions, frequency, and volatility over time. The methodology defines each metric and its calculation.
A visibility change can also reflect query fan-out, where an AI system expands one question into multiple retrieval paths and supporting subqueries.
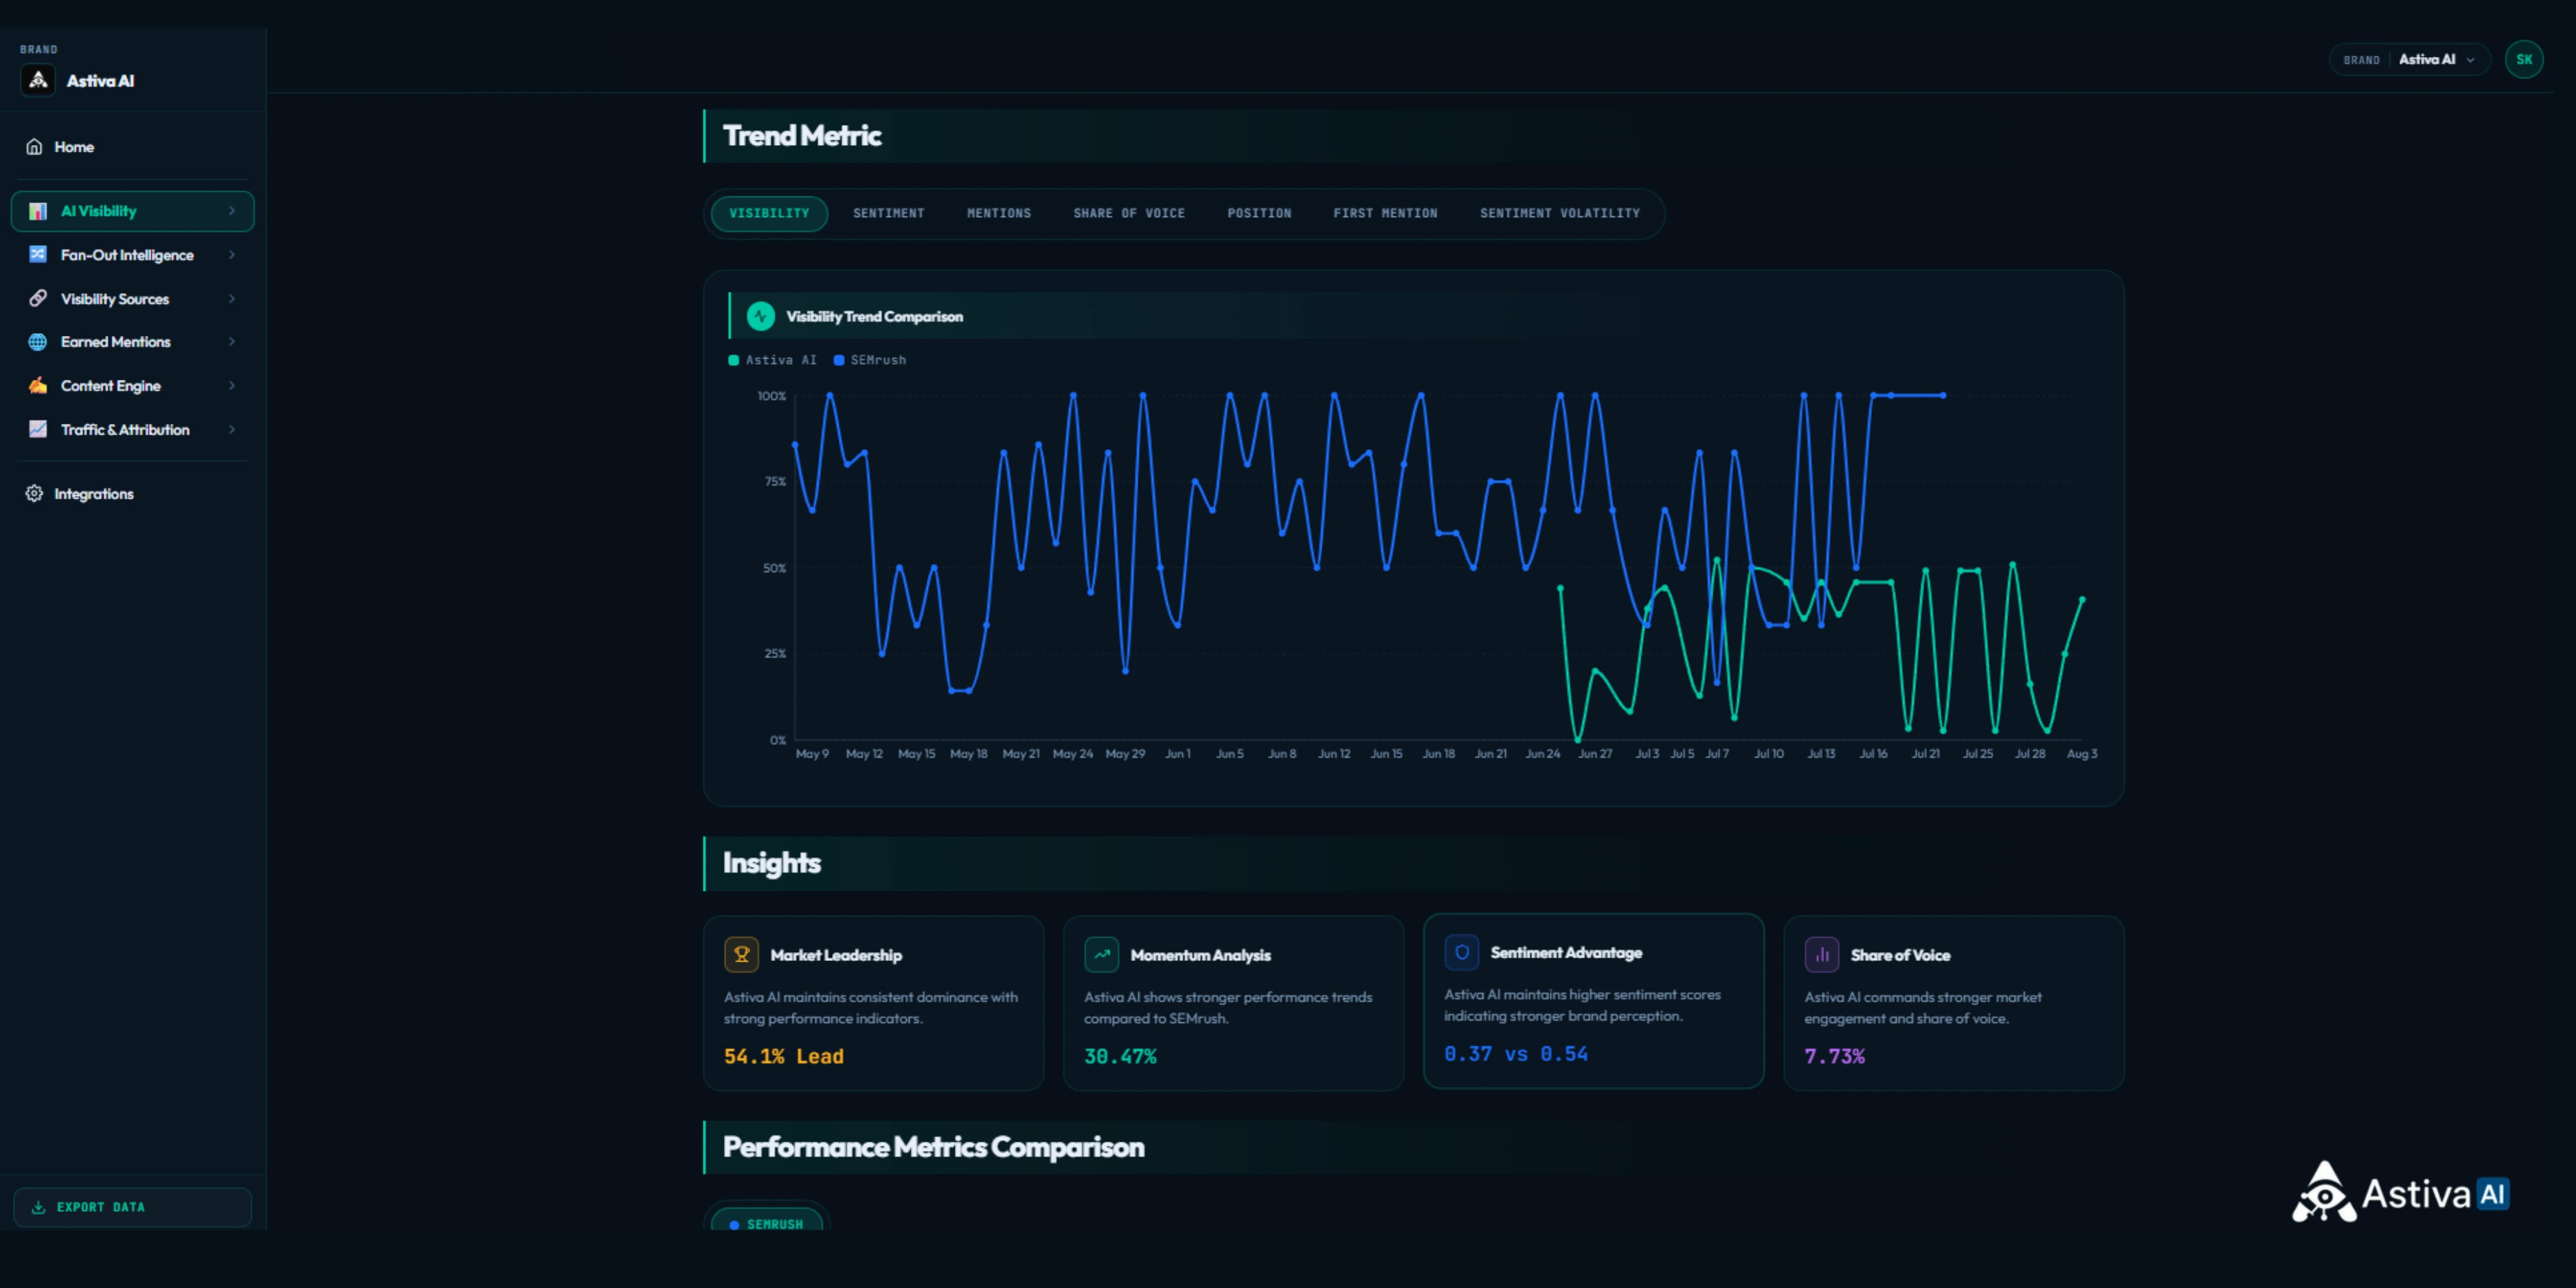
The Visibility Trend Comparison shows how selected brands move over time rather than reducing the analysis to one current-period score. Teams can switch among visibility, sentiment, mentions, Share of Voice, position, First Mention Rate, and Sentiment Volatility. The insight cards summarize the selected comparison, but the line pattern remains essential for separating a persistent advantage from a short-lived fluctuation or unequal data history.
Demo-data note: The dates, visibility values, calculated lead, momentum percentage, sentiment comparison, Share of Voice, and generated insight text apply only to this illustrative workspace, selected brands, prompt set, platforms, and reporting window. The two series begin at different points in the visible chart, so comparisons should use periods where both brands have data.
| Metric | Competitive question | What a worsening gap suggests |
|---|---|---|
| Visibility Percentage | Who appears more often? | Your brand is absent from more tracked prompts. |
| Share of Voice | Who owns more mentions? | Competitors are occupying more answer space. |
| Average Position | Who is named earlier? | Your brand is losing recommendation priority. |
| Brand Sentiment | Who is described more favorably? | The narrative, not only the frequency, is weakening. |
| First Mention Rate | Who is recommended first? | A rival is becoming the default association. |
| Mention Frequency | Who is repeated more often? | A competitor has broader topical coverage. |
| Sentiment Volatility | Whose narrative is less stable? | Reputation risk may be emerging before averages move. |
The public methodology defines these metrics and reports most at 24-hour, 7-day, and 30-day windows. The first use of each defined AISO term should also resolve to the AI search glossary.
How Do You Run a Head-to-Head Comparison Against One Rival?
A head-to-head comparison isolates one competitor after the broader dashboard shows where the difference matters. Select the rival and reporting period, then compare position, visibility, sentiment, mentions, Share of Voice, and supporting insights. The goal is to identify a bounded competitive problem, not declare one brand universally better.
Competitive outcomes may differ by platform, prompt set, geography, date range, model version, and citation availability, as shown in the analysis of ChatGPT vs Perplexity brand recommendations.
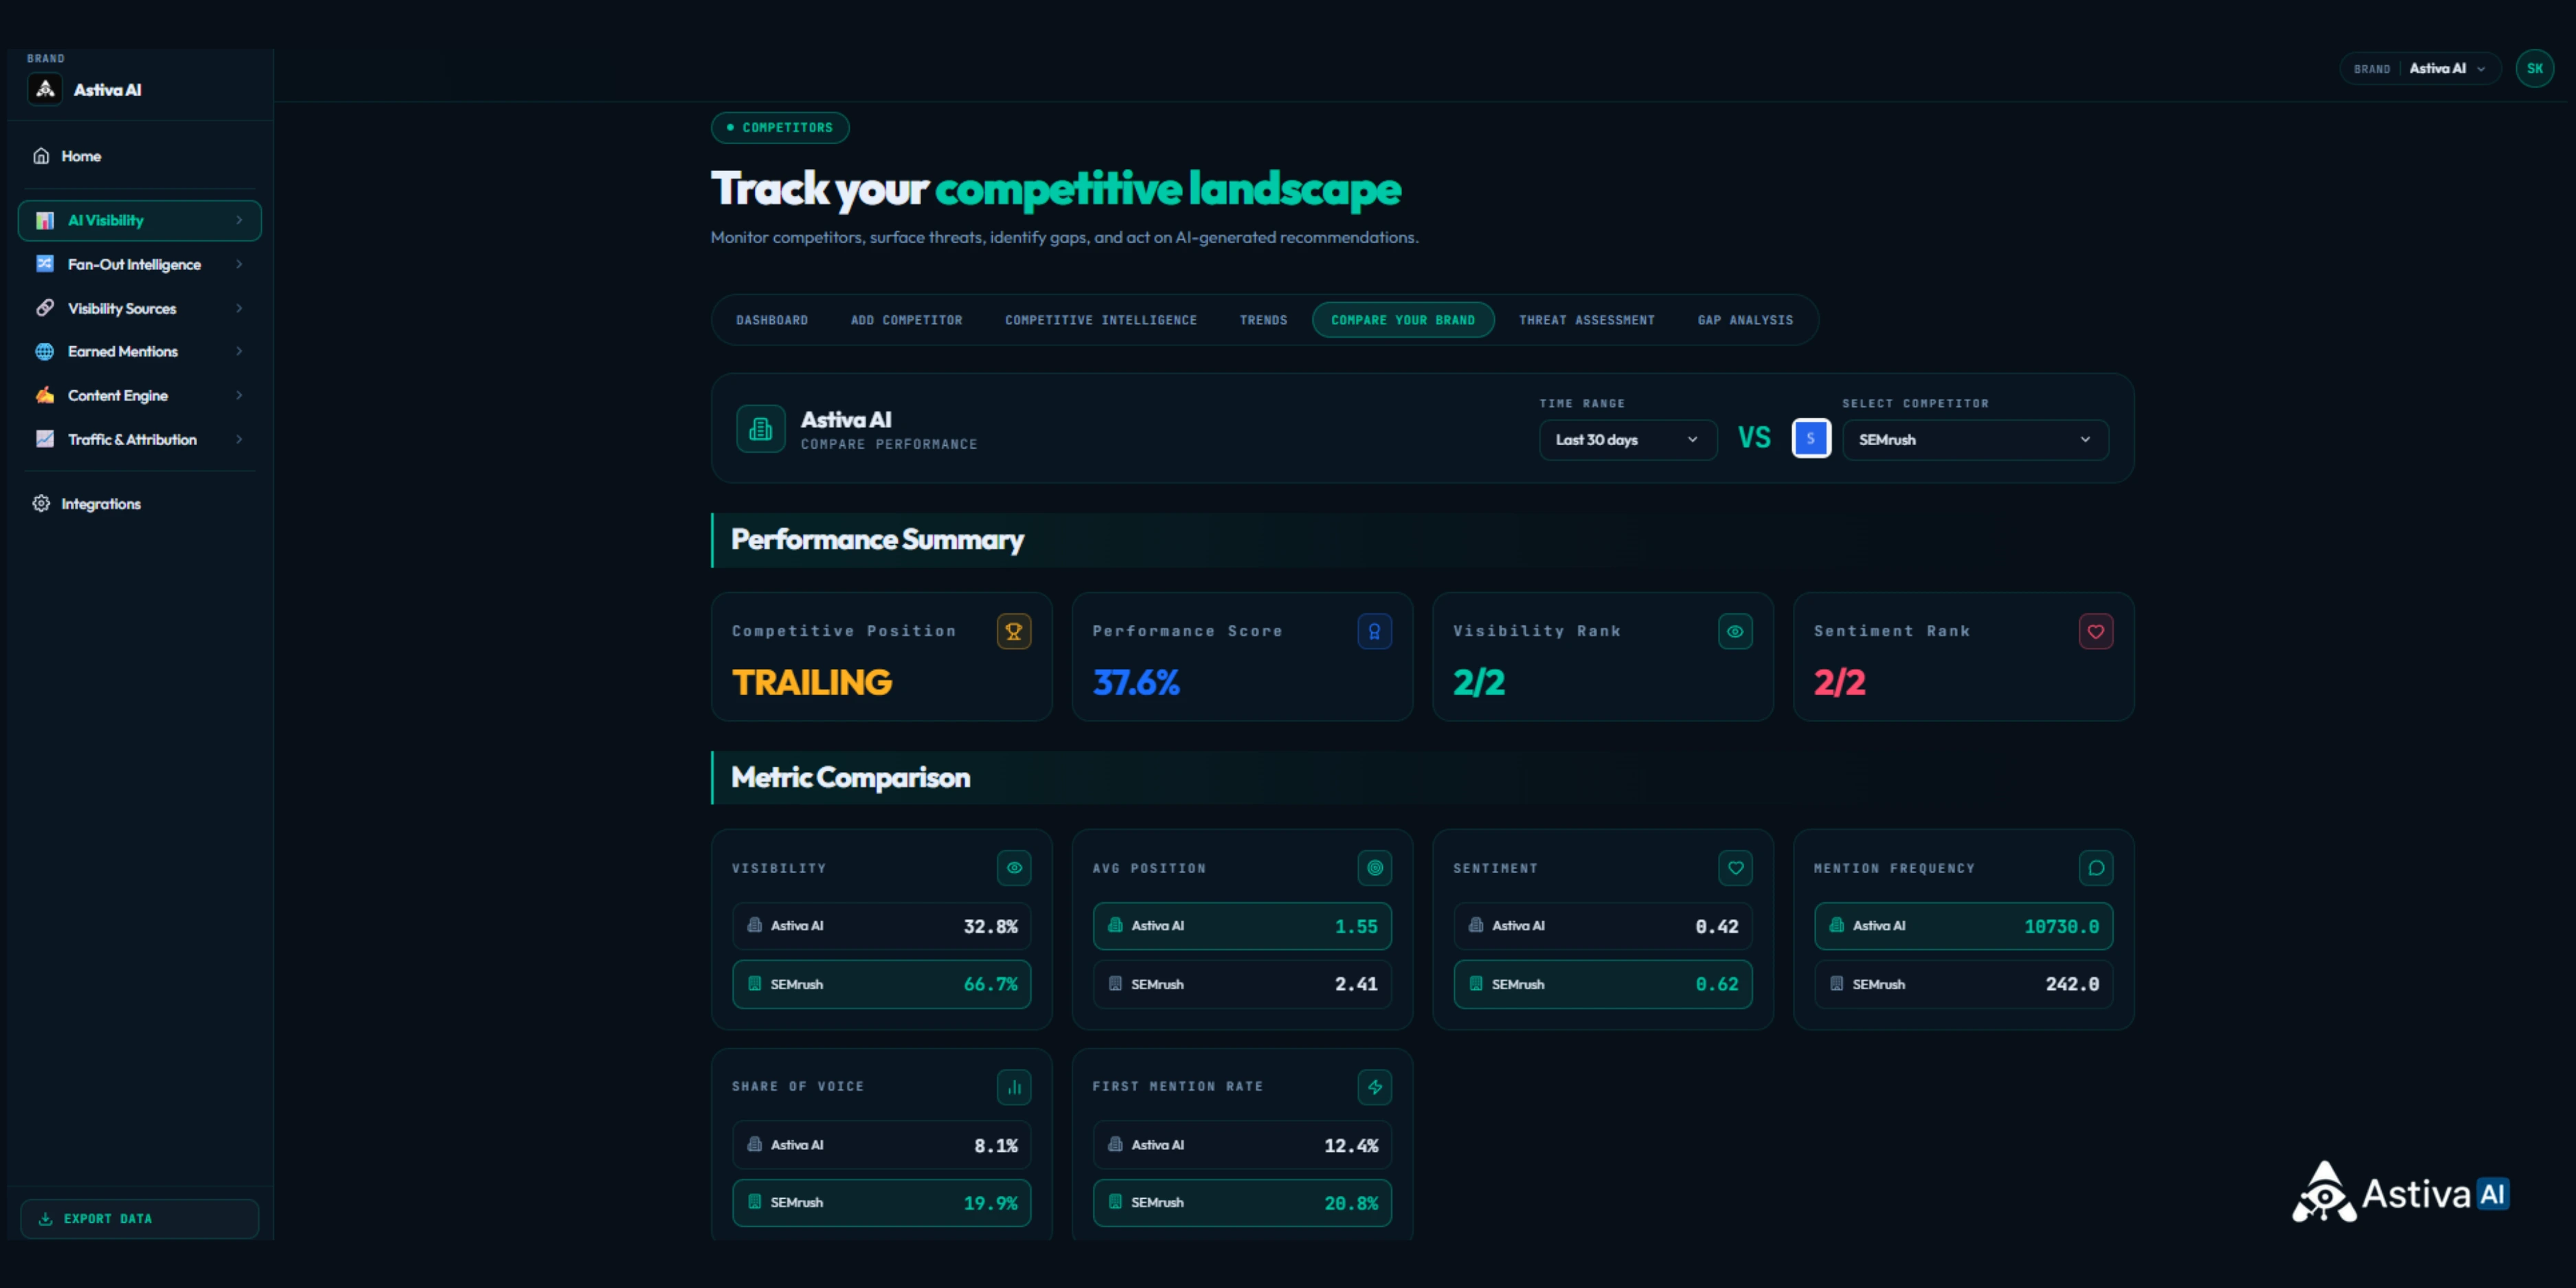
The Compare Your Brand view summarizes the selected rival, reporting period, competitive position, performance score, visibility rank, and sentiment rank before presenting the individual metric differences. In this illustrative comparison, Astiva AI leads on Average Position and Mention Frequency, while SEMrush leads on Visibility, Sentiment, Share of Voice, and First Mention Rate. The mixed result demonstrates why teams should diagnose the specific metric and prompt gap instead of relying only on the overall Trailing label.
Demo-data note: The competitive position, performance score, ranks, visibility, position, sentiment, mention frequency, Share of Voice, and First Mention Rate apply only to this illustrative workspace, selected brands, prompt set, platforms, last-30-day window, and product calculation rules. The screenshot is not an independent market ranking or a universal comparison of the named companies.
Use the comparison to separate quantitative differences from narrative differences. A competitor may lead on visibility but lose on sentiment, or lead on one platform while trailing elsewhere. Record the exact prompt and date range for every conclusion so the result remains reproducible.
Which Competitor Should You Prioritize First?
Prioritize the competitor with the strongest combination of commercial relevance, worsening trend, and actionable evidence. A large mention gap on low-intent prompts may matter less than a smaller but persistent disadvantage on purchase-intent prompts. Threat scoring should support judgment, not replace it.
- Commercial relevance of the prompts where the rival leads
- Direction and persistence of the gap
- Sentiment and positioning differences
- Quality and repeatability of the cited sources
- Effort required to close the gap
Threat Assessment ranks competitors by the severity and persistence of their competitive movement. Check the current product documentation for plan availability because product packaging can change.
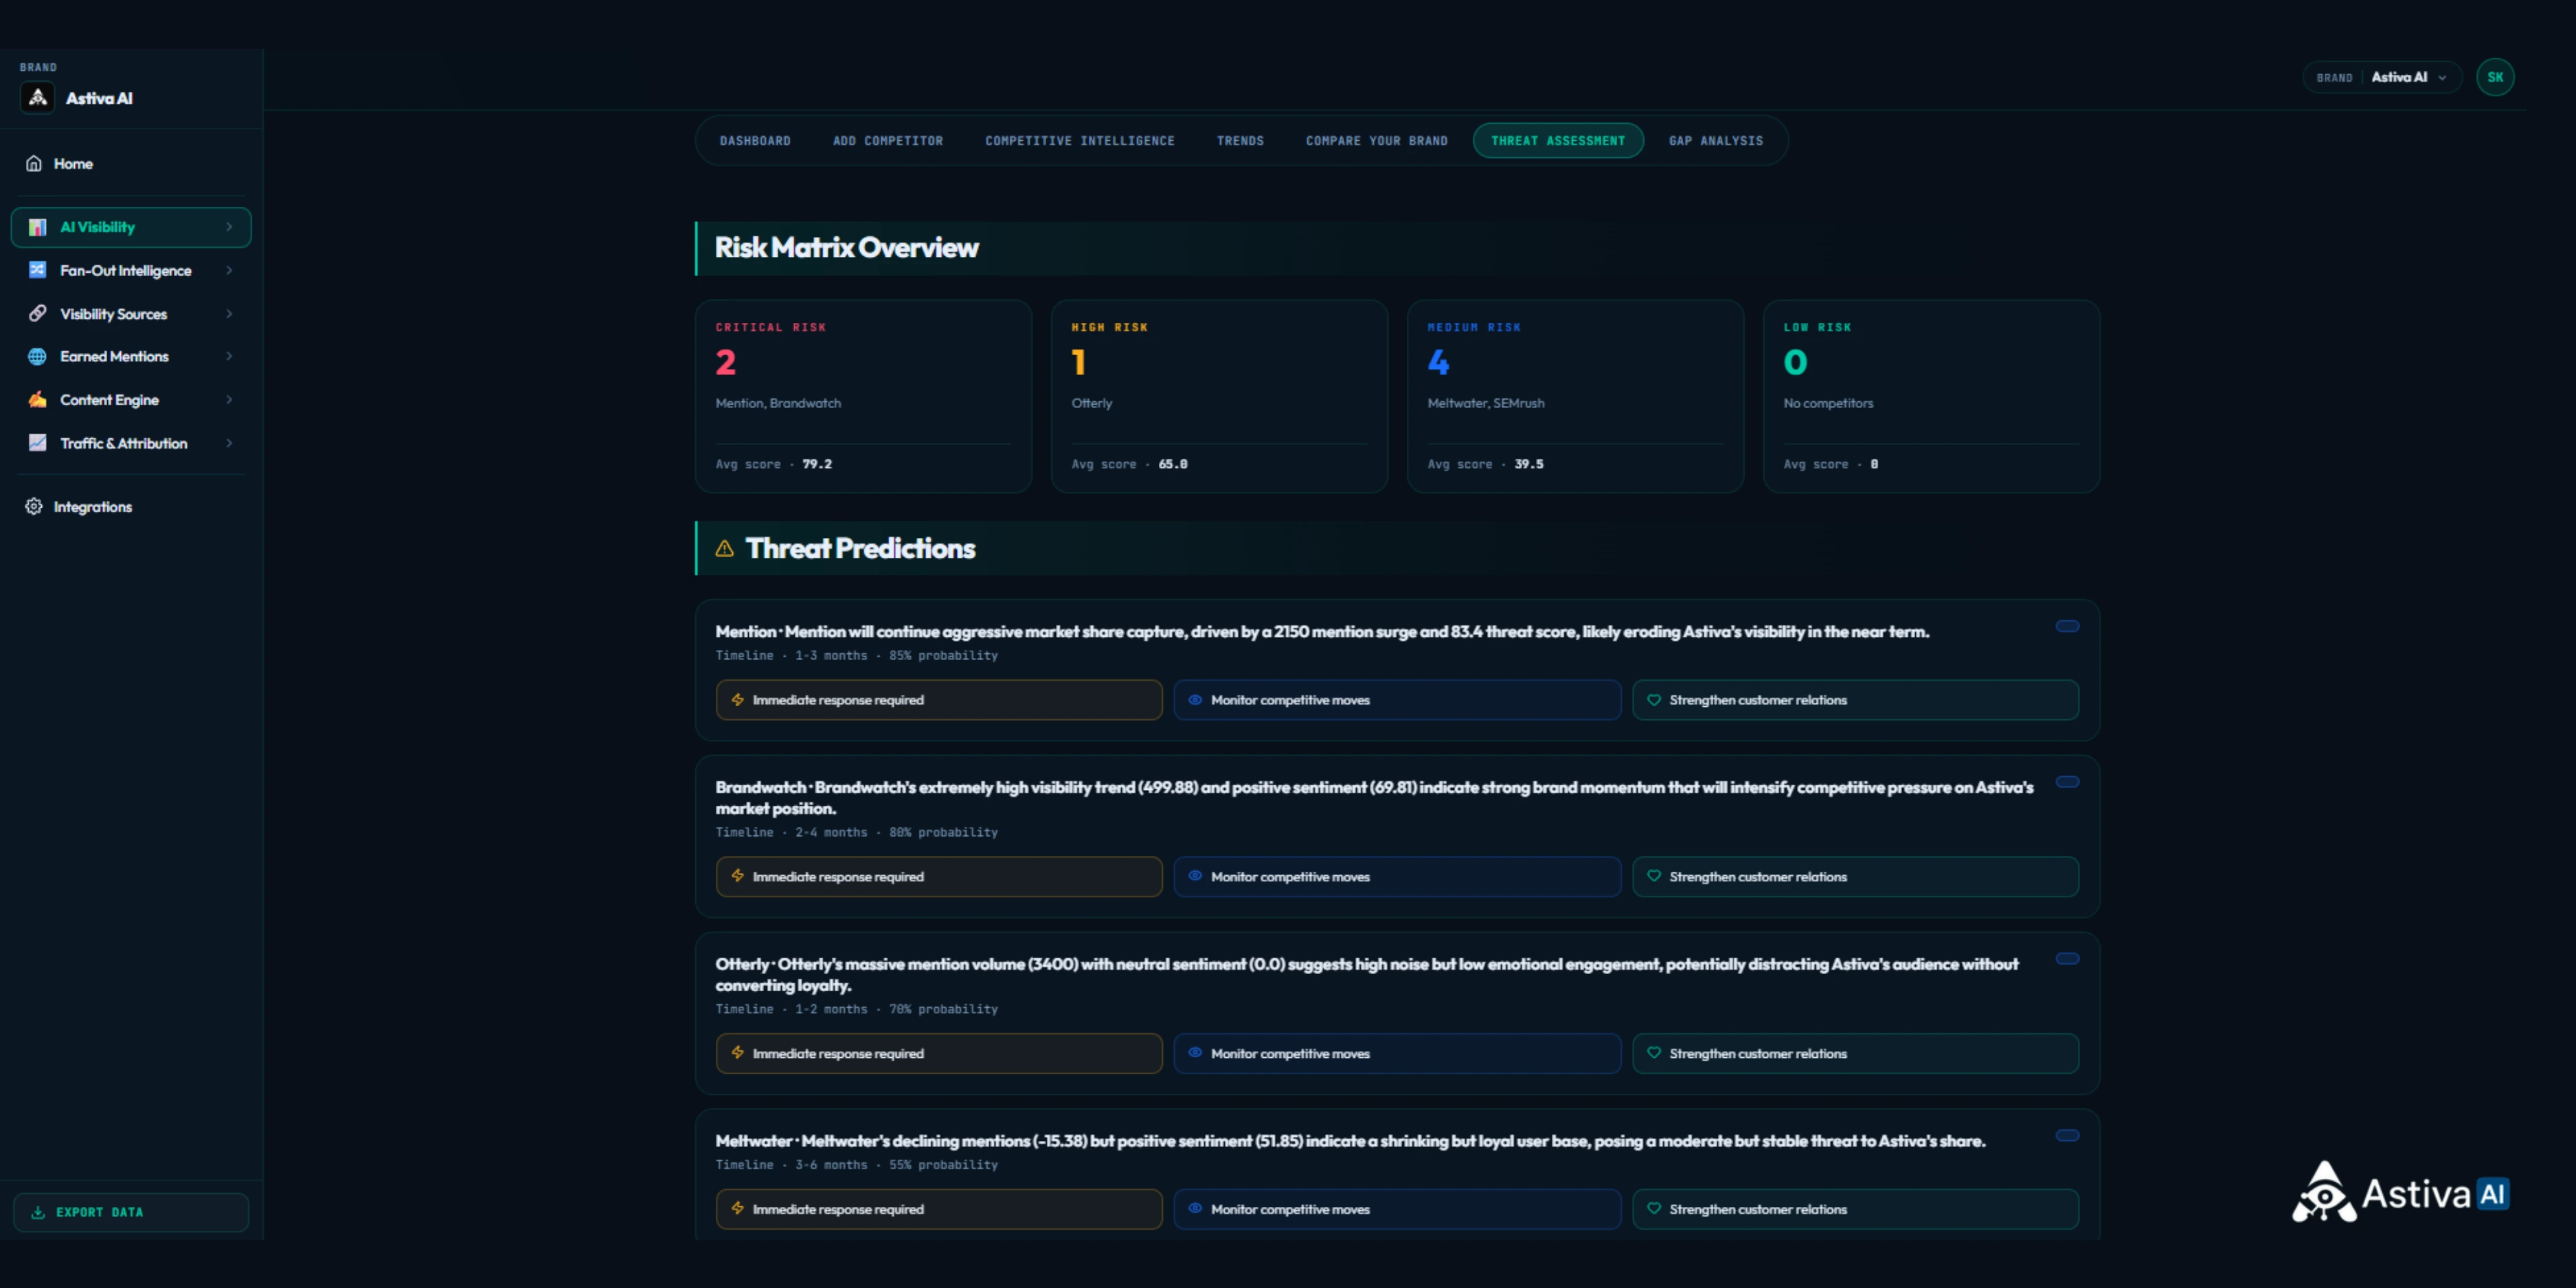
The Risk Matrix groups monitored competitors by current threat severity and displays the average score for each band. The Threat Predictions panel explains the signals associated with individual competitors, assigns an estimated timeline and probability, and surfaces possible response categories. Teams should use this view as a prioritization aid, then verify the underlying prompts, trend data, cited sources, and commercial relevance before committing resources.
Demo-data and forecast note: Risk groups, scores, competitor assignments, prediction narratives, timelines, probabilities, and response categories are illustrative product outputs for the selected workspace and reporting window. The forecasts are not independently verified predictions of the named companies' future performance and should not be treated as guarantees or financial advice.
Definition Echo
A competitor AI visibility gap is the measurable difference between how AI platforms mention, position, or support a rival and how they treat your brand on the same buyer-intent prompt.
How Does a Citation Gap Become a Content and Authority Plan?
A citation gap becomes a plan when the team maps the missing prompt to the competitor's cited sources, content angle, entity signals, and buyer context. The response may involve a new page, stronger inline evidence, clearer positioning, public documentation, or third-party authority rather than a generic rewrite.
A gap-closing asset should strengthen the evidence, entity associations, and third-party signals that influence how to get mentioned by AI on commercially relevant prompts.
When the shortfall is source-related, apply the techniques used to optimize content for AI citations, including answer capsules, inline evidence, primary-source attribution, and clear entity descriptions.
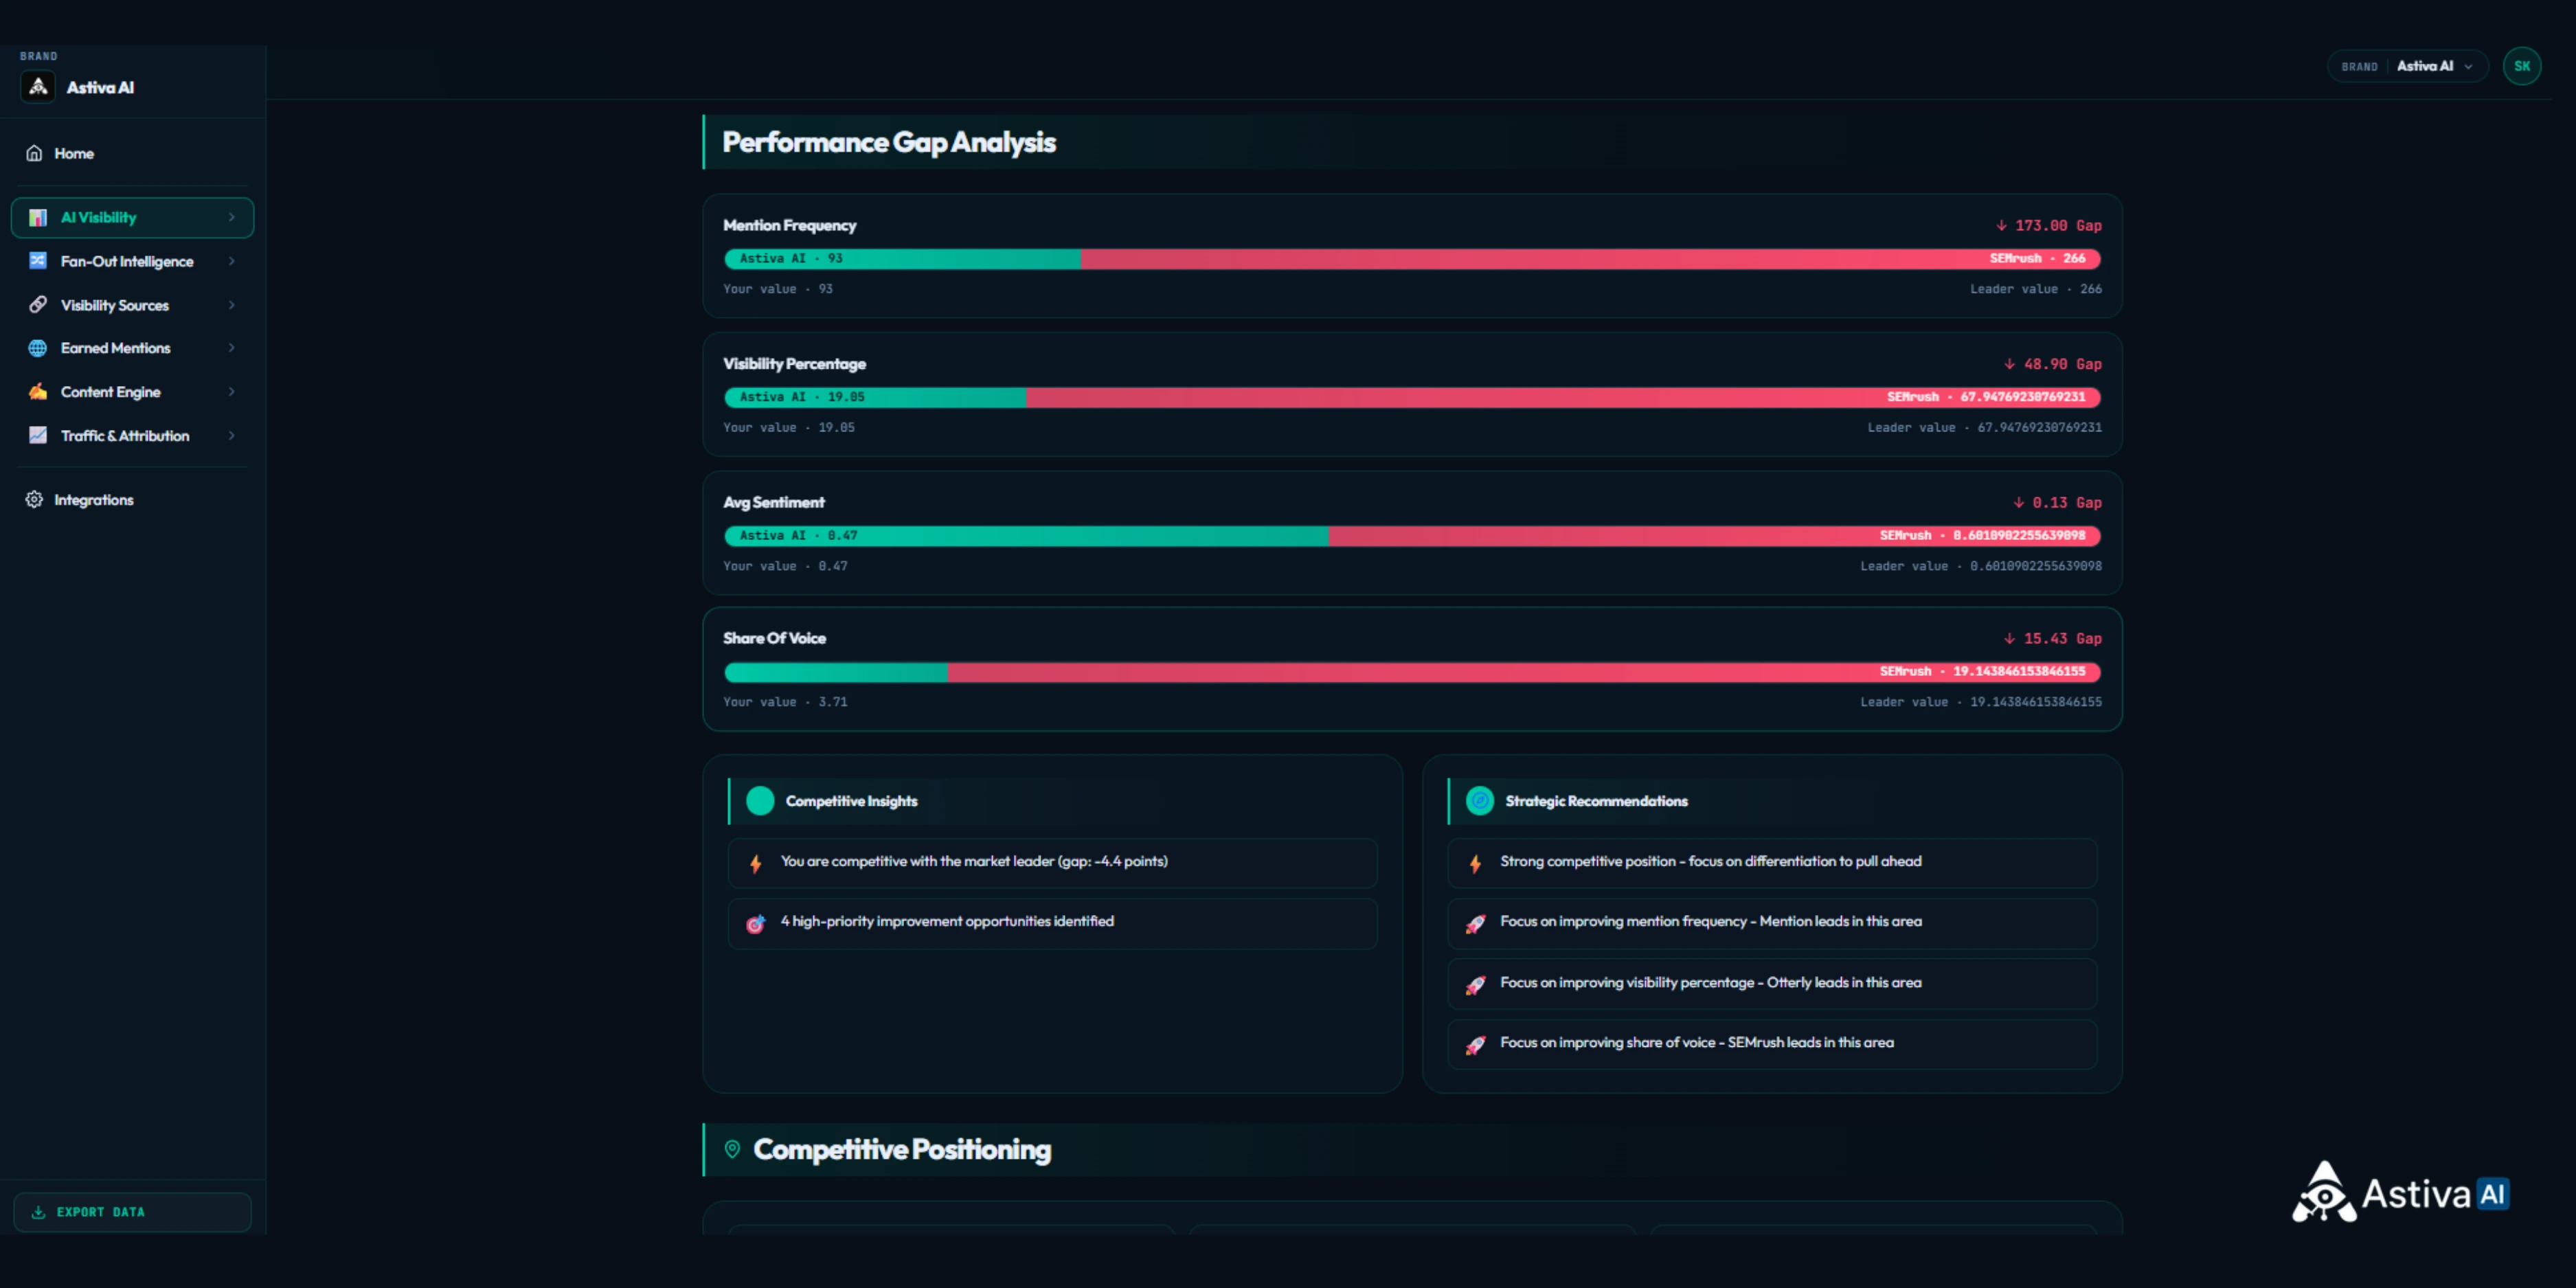
The view compares Astiva AI with the displayed leader across Mention Frequency, Visibility Percentage, Average Sentiment, and Share of Voice. In this illustrative workspace, the visible gaps are 173 mentions, 48.90 visibility points, 0.13 sentiment points, and 15.43 Share of Voice points. Competitive Insights summarize the current position, while Strategic Recommendations direct attention toward differentiation, mention frequency, visibility percentage, and Share of Voice. The recommendations should lead to a review of the exact prompts, sources, and positioning patterns behind each displayed gap.
Demo-data note: Brand values, leader values, gap calculations, named leaders, competitive insights, and strategic recommendations apply only to this illustrative workspace, selected query set, platforms, reporting window, and product calculation rules. The output is not an independent market ranking or a guaranteed action plan.
- Name the prompt and competitor creating the gap.
- Record the sources the AI platform cites or appears to rely on.
- Identify missing definitions, subtopics, evidence, or entity descriptions.
- Choose the smallest asset that closes the gap without cannibalizing an existing page.
- Publish with answer capsules, inline sources, structured data, and internal authority links.
- Track whether citation presence, sentiment, and conversions change after recrawl.
The Princeton GEO Study introduced Generative Engine Optimization as a formal optimization framework and tested it across a 10,000-query benchmark. Citing authoritative sources produced the largest lift (+115% visibility for position-5 pages), followed by adding statistics with named sources (+41%) and adding named expert quotes (+29%); keyword stuffing reduced citation rates by 10%. Aggarwal et al., KDD 2024.
In the Astiva AI Cycle, competitor tracking belongs primarily to Diagnose, while the resulting content and authority work moves into Displace. Measurement then returns through Prove, completing the Detect → Diagnose → Displace → Prove Cycle.
Brands compete on recommendations, not rankings.
What Should a Weekly Competitor AI Visibility Review Include?
A weekly review should end with one documented decision, not a collection of charts. Review the highest-intent prompts, compare current and prior periods, inspect the rival driving the largest gap, verify the source and positioning pattern, and assign one content, documentation, or authority action with a measurement date.
Teams can standardize this review with an AI visibility audit checklist that records the prompt, platform, competitor, source pattern, assigned action, and next measurement date.
- Check prompt-level changes on high-intent queries.
- Review cross-prompt visibility and Share of Voice.
- Inspect changes in AI-generated positioning and sentiment.
- Confirm whether the gap is persistent across reporting windows.
- Prioritize one rival and one fix.
- Record the publication, recrawl, and measurement dates.
Key Takeaways: Competitor AI Visibility Tracking
- A single tracked prompt's Competitors tab reveals which rival wins on that exact buyer-intent query, a result that a category-wide average can hide entirely.
- Ahrefs found only 38% of AI Overview citations come from pages ranking in Google's top 10 organic, down from 76% in July 2025 (Ahrefs, February 2026) — organic rank and AI citation are decoupling, which is why a separate competitor-tracking layer for AI answers is necessary.
- The seven-step workflow (Discover, Inspect, Benchmark, Interpret, Track, Prioritize, Act) moves from raw competitor data to a specific content or authority task with an owner and a measurement date.
- Positioning matters as much as mention frequency: two brands can have similar visibility while AI places them in different buying contexts, so reviewing recurring adjectives and use-case associations surfaces gaps a mention count alone would miss.
- Threat prioritization should combine commercial relevance, trend persistence, and evidence quality, not just the highest raw performance score, since a smaller but worsening gap on a purchase-intent prompt can matter more than a large gap on a low-intent one.
- A citation gap becomes actionable only once it is mapped to the exact prompt, competitor, cited sources, and missing subtopics — the response is the smallest asset that closes that specific gap, not a generic rewrite.
FAQ
What is competitor AI visibility tracking?
Competitor AI visibility tracking compares how AI platforms mention, rank, and describe your brand against named rivals on identical prompts and reporting windows. It combines prompt-level results with aggregate trends so teams can see who is being recommended, where the gap is widening, and which citation, positioning, or content actions should be prioritized.
How is AI competitor tracking different from SEO competitor tracking?
SEO competitor tracking focuses on rankings, keywords, backlinks, and search-result visibility. AI competitor tracking evaluates generated answers, including whether a brand is named, where it appears, how it is described, which sources support the answer, and which competitors receive the recommendation.
Which metrics should be compared on the same AI prompt?
A useful prompt-level comparison includes Visibility Percentage, Share of Voice, Average Position, Brand Sentiment, First Mention Rate, Mention Frequency, and Sentiment Volatility. The public Astiva AI methodology defines these seven AISO metrics. Use the same prompt, platform, and reporting window for every brand.
How often should teams analyze competitors in AI-generated answers?
Monitor high-intent prompts daily and review competitive trends weekly or monthly, depending on query volume and market volatility. Compare the current period with a prior period rather than relying on one generated response.
Where can I see competitor results for one tracked prompt?
Open Tracked Prompts, select a completed prompt, and choose the Competitors tab. The view compares the brand with tracked competitors on position, visibility, mentions, Share of Voice, and sentiment for that exact prompt.
How many competitors can Astiva AI track per brand?
As verified on August 4, 2026, Astiva AI tracks 3 competitors per brand on Lite, 5 on Starter, 10 on Growth, 15 on Pro, and unlimited competitors on Enterprise. Check the current pricing page for the latest limits.
What is the difference between Trends and Compare Your Brand?
Trends shows how selected competitors move over time across the same measurement set. Compare Your Brand is a focused head-to-head view against one rival over a selected period.
How does a citation gap become a content plan?
A citation gap becomes actionable when the team identifies the exact prompt, competitor, cited sources, missing subtopics, and positioning difference. The response may require new content, stronger evidence, clearer entity descriptions, or third-party authority signals.
Related AI Visibility Resources
Continue with the supporting guides most closely connected to competitor monitoring, citations, and recurring audits.
How to Get Mentioned by AI · Optimize Content for AI Citations · AI Visibility Audit Checklist
Sources
Ahrefs, "Update: 38% of AI Overview Citations Pull From the Top 10," March 2, 2026. Aggarwal et al., "GEO: Generative Engine Optimization," arXiv:2311.09735, KDD 2024. Methodology, last checked August 3, 2026. Pricing, verified August 3, 2026. AI search glossary, last checked August 3, 2026.
About Astiva AI
Astiva AI is the Competitive Intelligence platform for AI Search and Visibility, tracking how ChatGPT, Claude, Gemini, Perplexity, and other major AI platforms recommend your brand versus competitors. The platform combines daily monitoring, citation gap analysis, gap-driven content generation, and native GA4 revenue attribution. Plans start at $29 per month, with a free analysis and a 7-day trial on paid plans. Astiva AI connects competitor intelligence with continuous AI brand monitoring, citation-gap analysis, content action, and revenue attribution. Turning AI recommendations into Brand Competitive Intelligence.